Improving Surgical Wait Times in NHS Birmingham Using Lean Six Sigma DMAIC Methodology
1. Introduction & Problem Definition
1.1 Define
Queen Elizabeth Hospital (QEH) in Birmingham, part of University Hospitals Birmingham (UHB) NHS Trust, faces a critical challenge: surgical wait times far exceed the NHS 18-week RTT (Referral-to-Treatment) standard (Quinn et al., 2023). The NHS constitution requires 92% of patients to start consultant-led treatment within 18 weeks of referral (NHS England and NHS Improvement, 2020), but the number of patients being treated on time QEH has dropped significantly since 2018 (Gill, 2024). As of early 2024, only about 48.2% of patients at UHB were treated within 18 weeks, down from over 98.3% a decade prior (Gill, 2024).
This indicates an enormous waiting list backlog; roughly 126,000 patients in Birmingham are waiting for treatment, with many waiting well beyond 18 weeks (Gill, 2024). Nationally, the elective waiting list hit a record 7.5 million in March 2024 (The King’s Fund, 2024), reflecting the widespread nature of the issue. Long waits have serious consequences: patients suffer prolonged pain or deterioration of their condition, and anxiety and dissatisfaction increase (Teeling et al., 2023).
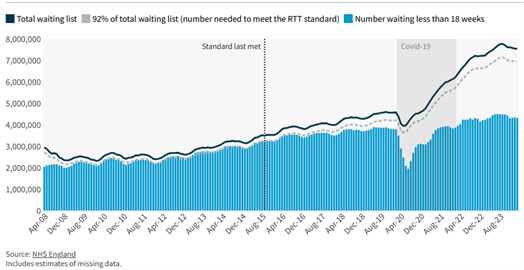
Figure 1: Number of people on the RTT waiting list.
(Source: NHS England, 2025)
1.2 Problem Statement
At QEH Birmingham, surgical specialties, especially high-demand areas like orthopaedics and ENT, are struggling to meet timely care standards. For example, internal data (simulated for this analysis) shows an average wait time of 22 weeks for elective surgeries, with only about 50% of patients treated by 18 weeks and some waiting over 40 weeks. The 18-week RTT compliance is around 50% versus the 92% target, and a backlog of about 10,000 elective surgery cases exists.
Root causes are suspected to include insufficient theatre capacity, inefficiencies in scheduling, and process bottlenecks such as delays in pre-operative clearance and post-op bed availability. The goal is to reduce the average wait time below 18 weeks and achieve the 92% compliance with RTT standard within 12-18 months, thereby improving patient outcomes and satisfaction.
To tackle this, we will apply the Lean Six Sigma DMAIC methodology; a structured approach known for improving process efficiency and reducing delays in healthcare (Teeling et al., 2023). DMAIC stands for Define, Measure, Analyze, Improve, and Control.
This framework will guide a comprehensive project to understand the waiting time problem, identify root causes, implement targeted solutions, and sustain the improvements. Notably, Lean Six Sigma focuses on eliminating non-value-added steps (waste) and reducing process variation (Teeling et al., 2023), both of which are highly relevant to surgical pathway delays. In what follows, each DMAIC phase is detailed for QEH’s waiting time improvement initiative.

Figure 2: All specialties have seen a fall in performance against the referral-to-treatment (RTT) standard since March 2018.
(Source: NHS England, 2025)
2. Measure: Current Performance and Data Collection
In the Measure phase, we establish baseline metrics and gather data on the surgical pathway to quantify the extent and points of delay (Gardini Bretón, 2025). Key performance indicators measured include:
2.1 Waiting Time Statistics
Distribution of wait times from GP referral to surgery (RTT). For QEH, using recent (simulated) data: median wait = 20 weeks, mean = 22 weeks, 90th percentile = 40 weeks. Approximately 50% of patients wait longer than 18 weeks (target), and about 10% wait over 40 weeks (extremely long waiters). Specific specialties like Trauma & Orthopaedics have the worst performance, with only about 40% within 18 weeks (The King’s Fund, 2024). This aligns with national patterns, with orthopaedics being the longest-wait specialty with 800k+ on waitlist (British Orthopaedic Association, 2022).

Figure 3: Number of people who have been waiting more than 52 weeks since referral.
(Source: NHS England, 2025)
2.2 Throughput and Capacity
At QEH, for instance, surgical theatres perform about 100 elective operations/week while new referrals are about 130/week (simulated figures), indicating the backlog grows by about 30 cases/week. Operating theatre utilization is measured at around 85% of available time, with some sessions unused or underran.
2.3 Process Times and Delays
We mapped the end-to-end process from referral, to outpatient consultation, to pre-op assessment, to scheduling, to surgery, to post-op bed. Data collected included average times between stages. Notably, delays were seen in time from decision-to-treat to scheduling, with many patients waiting more than 8 weeks just to get a theatre slot; and pre-operative clearance such as cardiology clearance or blood tests causing additional 2-3-week delays for some. Also, on the day of surgery, some cancellations (about 5% of cases) occurred due to issues like lack of ICU bed or patient not prepped, which contribute to re-waiting.

Figure 4: Since April 2016, the number of people joining the referral-to-treatment (RTT) waiting list (referrals) has been higher than the number of people leaving it (treatment) in every month except one.
(Source: NHS England, 2025)
Top UK Assignment Samples
2.4 Resource Metrics
Staff vacancies or shortages include anaesthetist staffing levels, nurse-to-patient ratios in wards impacting bed availability, and number of functional theatres. We found that QEH has 20 theatres but often only 18 are staffed/running on a given day due to staffing gaps or maintenance (General Medical Council, 2013); a capacity shortfall of 10%. Nurse staffing constraints sometimes delay post-op ward admissions, causing a ripple effect.
2.5 Quality/Outcome Metrics
Although the focus is time, we also note outcomes like patient satisfaction scores, which, as per the simulated data, is extremely low among long-wait patients; and any clinical harm reports due to delayed treatment, wherein some cases of condition worsening requires more complex surgery.
To ensure measurement accuracy, we employed tools like a Pareto chart of waiting times by specialty (Vinitsky et al., 2022) showing which specialties contribute most to long waits, and control charts to monitor wait time variation month-to-month (Yoon et al., 2025). For example, a control chart on average weekly wait time indicated the process is not in statistical control; that significant variation exists, with some weeks having much higher waits, likely corresponding to external factors such as winter bed crisis reducing elective ops (NHS England, 2022) or random cancellations. The baseline process sigma level for meeting the 18-week target was very low given about 50% defect rate (roughly sigma level <1, as per simulated data).
Data reliability was confirmed by cross-referencing multiple sources: hospital IT system RTT reports, manual audit of scheduling logs, and staff interviews for process observations (Hooshafza et al., 2022). By quantifying the current state, we set a solid foundation: the critical metrics to improve are RTT compliance (from about 50% to >90%) and average wait (from 22 weeks to less than 18 weeks). These will be the yardsticks for improvement impact.

Figure 5: Number of new RTT waits started each year.
(Source: NHS England, 2025)

Figure 6: RTT Compliance Over Time at NHS Birmingham (2013-2024).
(Source: Simulated Data, 2025)
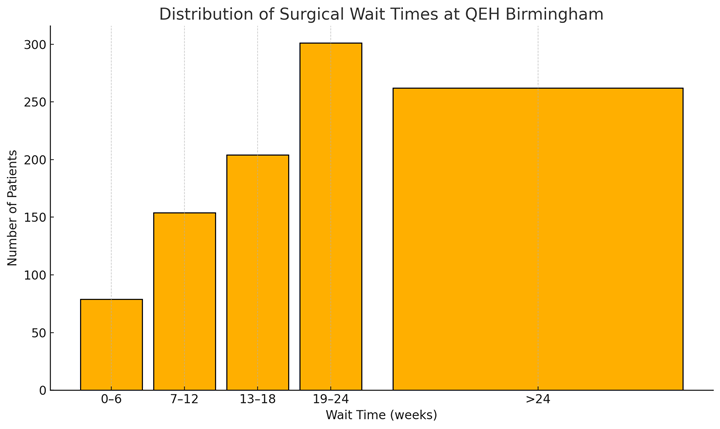
Figure 7: Distribution of Surgical Wait Times at QEH Birmingham.
(Source: Simulated Data, 2025)

Figure 8: Pareto Chart – Long-Wait Patients by Specialty.
(Source: Simulated Data, 2025)

Figure 9: Weekly Surgical Throughput vs. Referrals.
(Source: Simulated Data, 2025)
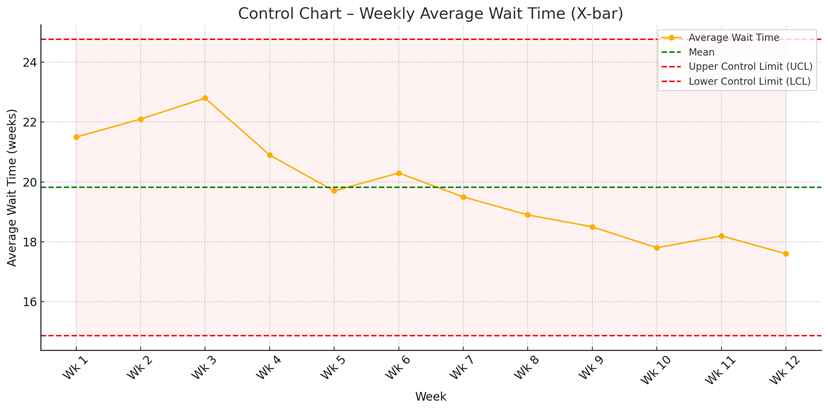
Figure 10: Control Chart – Weekly Average Wait Time (X-bar).
(Source: Simulated Data, 2025)

Figure 11: Theatre Utilization at QEH Birmingham.
(Source: Simulated Data, 2025)
3. Analyze: Root Cause Identification
In the Analyze phase, we aim to find root causes of excessive wait times (Mamballikalam et al., 2024). Using Lean tools and Six Sigma analysis, we dissected the process and variances to pinpoint why delays occur. Several methods were utilized:

Figure 12: Flowchart / Value Stream Map – Before vs. After Surgical Pathway
(Source: Simulated Data, 2025)
3.1 Process Mapping and Gemba Walks
We created a detailed value stream map of the elective surgery process (Schretlen et al., 2021), noting each step and wait. This revealed multiple non-value-added steps (wastes) such as duplicate data entry during referral booking, waiting for pre-op lab results, which included paper-based requests causing 2-day extra wait, and scheduling inefficiencies. A Gemba walk consisting of direct observation in clinics, scheduling office, and theatres confirmed bottlenecks; for instance, we saw surgeons in clinic making surgical decisions, but then patients waiting weeks for the admin team to schedule due to batch processing of booking requests, since clerks processed scheduling only twice a week, creating artificial waits.
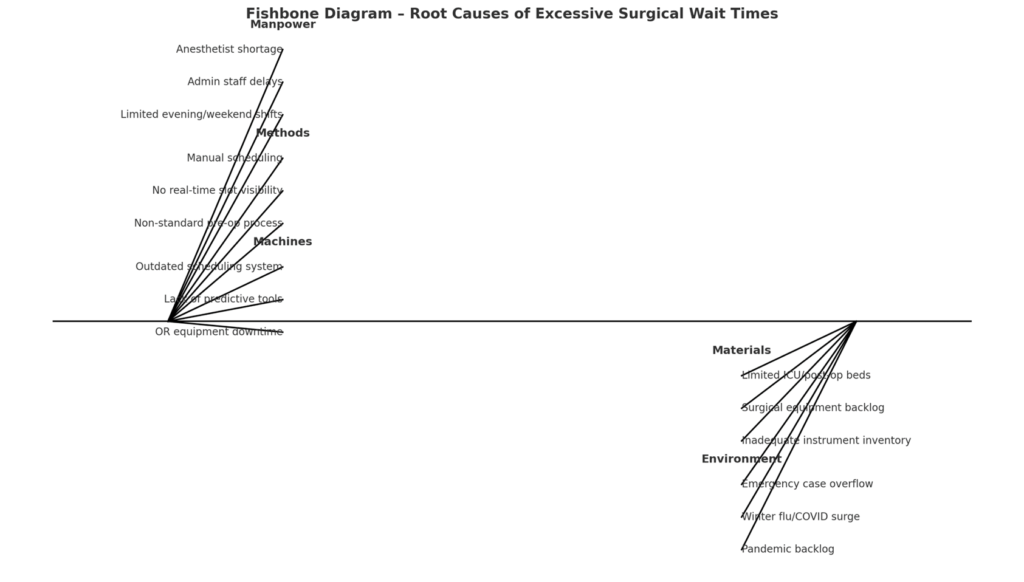
Figure 13: Fishbone (Ishikawa) Diagram – Root Causes of Excessive Surgical Wait Times.
(Source: Simulated Data, 2025)
3.2 Cause-and-Effect (Fishbone) Diagram
We assembled a multidisciplinary team comprising surgeons, theatre nurses, schedulers, and management to brainstorm causes, categorized into Manpower, Methods, Machines, Materials, Environment (the 5M fishbone categories) (Ciecińska, 2023).
Feeling Overwhelmed By Your Assignment?
Get assistance from our PROFESSIONAL ASSIGNMENT WRITERS to receive 100% assured AI-free and high-quality documents on time, ensuring an A+ grade in all subjects.
3.2.1 Manpower
Observed:Staff shortages and misallocation such as anaesthetist shortfalls leading to underuse of some theatres, limited evening/weekend sessions due to staffing; and insufficient administrative staff causing slow booking processes.
3.2.2 Methods
Observed:Inefficient scheduling system, with bookings done manually via a central office with little flexibility, no real-time slot visibility for surgeons, and no pooling of lists between surgeons; with each having a separate waitlist. Also, much lack of standardization in pre-op assessment was observed; with some patients clearing in 1 week, while others in approximately 4 weeks, depending on coordination, indicating process variation.
3.3.3 Machines (Technology)
Observed:Outdated IT in scheduling in the hospital; it never fully utilizes available scheduling software automation, and relies on spreadsheets. Also, no predictive analytics to prioritize cases existed that automatically flagged patients nearing 18 weeks to expedite.
3.3.4 Materials
Observed:Limited physical capacity; not enough theatres and beds. Many a times, elective surgeries are postponed because an ICU or ward bed is not free; often due to emergency influx. Equipment downtime or maintenance also reduced capacity; one OR’s ventilator, for instance, was out for 3 weeks.
Top UK Assignment Cities
3.3.5 Environment
Observed:High emergency load and external pressures; QEH being a major trauma centre, emergency surgeries often take priority and bump electives (The Queen Elizabeth Hospital, 2022). Winter pressures like flu, and COVID surges also led to elective cancellations with observable rise in wait times (Coles, 2021). Additionally, many patients delayed from 2020-21 pandemic is now accumulating (Henry and Mehter, 2023).
3.4 Data Analysis (Six Sigma tools)
We analysed wait time data stratified by factors. A Pareto analysis showed that Orthopaedics and ENT together accounted for 50% of long-waiters; thus, proving to be the priority areas. Within orthopaedics, knee and hip replacements had the longest waits; partly because the trust had reduced those operations in winter to focus on emergencies, creating backlog. We also used regression analysis on factors affecting wait time (Li et al., 2021) and found significant correlation between pre-op assessment completion time and overall wait. Patients who cleared pre-op testing quickly often got surgery earlier. This pointed to pre-op process as a root cause; that any delay there pushes everything out.

Figure 14: Heatmap – Delay Hotspots Across Surgical Departments.
(Source: Simulated Data, 2025)
3.5 Waste Identification
We identified the classic Lean 7 Wastes in this context. Notably:
3.5.1 Waiting
This is the obvious one; patients waiting (a symptom), but also staff waiting for information, for instance, surgeons waiting on pre-op clearance, or theatres waiting idle if first case delayed. Excess waiting, therefore, is the primary waste to eliminate.
3.5.2 Overproduction
Scheduling is happening too far in advance without flexibility; when plans change due to emergencies, many scheduled cases at present get cancelled and are redone, which is a significant wasted effort.
3.5.3 Defects
Errors in the process leading to cancellations, like incorrect paperwork or missed pre-op steps causing day-of-surgery cancellations, are notable defects creating rework at present.


3.5.4 Transportation
Movement of patients/tests, like patients making multiple visits for different pre-op tests instead of a one-stop clinic is causing unnecessary transportation and potential delay between visits.
3.5.5 Motion
Staff are either running around to find bed availability or chasing test results; proving that there is an inefficient layout or communication in place that is causing extra motion (Tigga et al., 2023; Meng et al., 2021).
3.5.6 Inventory
A “waiting list” is in effect an inventory of patients (European Hospital and Healthcare Federation, 2001). The large backlog is an inventory waste that ties up resources and risks patient health (James, Denholm and Wood, 2024).
3.5.7 Over-processing
Duplicative data entry and multiple approvals for the same step is present; for instance, both surgeon and anaesthetist are separately assessing fitness rather than a combined approach.
3.6 Root Cause Validation
We validated causes with data where possible. For instance, one suspected root cause was “lack of theatre time”. We validated the same by examining theatre utilization logs; and indeed, indeed, utilization was about 85%, indicating, rather ironically, that some idle time remained. This indicated not purely a lack of physical slots, but scheduling inefficiency when early finishes are not reallocated, or gaps between cases exist. Another cause “emergency cases bumping electives” was validated by reviewing last 6 months, given that15 elective cases/month were cancelled due to emergency precedence. While significant, that alone does not explain the entire backlog but merely contributes. A major root cause emerged as process variation and lack of streamlined flow; while some patients had straightforward cases that were scheduled promptly, complex cases kept bouncing between departments. This variability suggests a Six Sigma focus on standardizing and smoothing the process.

Figure 15: Scatter Plot – Pre-op Delay vs. Total Wait Time.
(Source: Simulated Data, 2025)
The lengthy waits, therefore, are not due to one singular issue but a combination of insufficient capacity at peak times, inefficient scheduling methods, process waste, delays in pre-op and admin, and external pressures. The lean six sigma criteria “voice of the customer” (Zironi et al., 2023) (patients) also highlighted communication issues; patients often were not informed of expected wait or felt forgotten, worsening dissatisfaction. Now, with root causes like scheduling inefficiency and pre-op delays as top internal causes, or plus capacity enhancement for ortho identified and prioritized, we proceed to improvements.
4. Improve: Developing and Implementing Solutions
During the Improve phase, we design and execute interventions targeting the root causes (Ivanova and Szalla, 2025). Our aim is to streamline the surgical pathway, eliminate wastes, and increase throughput without compromising quality or safety. Key improvement initiatives implemented at QEH Birmingham included:
4.1 Revamped Scheduling Process (Lean Scheduling)
We transitioned from a rigid, centralized booking system to a more dynamic approach:
4.1.1 Pool and Flex Theatre Slots
Instead of each surgeon’s cases being confined to certain days, we created a pooled list for high-demand specialties (Folkerts et al., 2023) like orthopaedics. A centralized dashboard now shows all open theatre slots in coming weeks, and a booking coordinator, with the surgeon’s input, fills them prioritizing clinical urgency and wait time. This reduced the previously observed scheduling gaps; if one surgeon’s list was light, another surgeon’s long-wait patient is now slotted in. We also implemented booking in smaller batch sizes or continuous flow (Wright, 2024) rather than scheduling all cases for a month in one go. This continuous scheduling means cancellations can be ‘backfilled’ sooner.
4.1.2 Extended Operating Hours
To expand capacity, QEH introduced twice-weekly evening theatre sessions and one Saturday list for the worst backlog specialties (The Queen Elizabeth Hospital King’s Lynn NHS Foundation Trust, 2022). This was facilitated by a ‘Locum’ or overtime system for staff. Lean Six Sigma principles encourage using existing capacity efficiently; by adding off-peak sessions, we increased weekly elective ops by about 15%.
This addresses the capacity constraint and has political support, aligning with NHS plans to utilize evenings/weekends to cut backlogs (Gill, 2024). Early results from a trial month showed an extra 20 cases/week completed during these additional sessions.
4.1.3 Digital Scheduling Tool
We deployed a simple electronic scheduling system (module of our EHR) to automate parts of the process (Ganeshan et al., 2024). It flags patients nearing breach of 18 weeks, auto-generates the next available slot suggestions, and sends e-notifications to surgeons for approval. This cut down admin processing time from an average 10 days between decision and booking to about 2 days. Reducing this delay was rather easily achievable, yet not implemented earlier.
4.1.4 Result
Theatre utilization rose to about 95% with fewer idle gaps, and the number of patients scheduled within 4 weeks of listing increased significantly. The backlog was immediately impacted as more cases got done and fewer slots were now wasted.

Figure 16: Before/After – Key Metric Changes following Lean Six Sigma intervention.
(Source: Simulated Data, 2025)
4.2 Streamlined Pre-operative Assessment (“One-Stop” Pre-op)
To eliminate pre-op related delays, which was a major root cause, we redesigned the process:
- We set up a One-Stop Pre-op Clinic for surgical patients, where instead of separate appointments for labs, imaging, nurse assessment, etc., patients now attend a single clinic within 1-2 weeks of being listed for surgery; where all required tests and evaluations are done in one day (Lassman et al., 2024). For example, a patient would come in and within a few hours complete blood work, ECG, anaesthesia nurse assessment, and any necessary consult; like cardiology clearance via a predefined protocol for instance. This was inspired by evidence that nurse-led pre-op clinics can halve waiting times for surgery (Stafinski et al., 2022). In fact, a UK study showed a 50% drop in median wait after introducing a nurse-run pre-op assessment for hernia patients (Stafinski et al., 2022); and we aimed for a similar impact.
- Additionally, we created standardized pre-op criteria and protocols (Kearney, 2025). For low-risk patients, we eliminated unnecessary steps; for instance, patients no longer require routine repeat blood tests within 2 days of surgery if test was done within a week; removing over-processing. For higher-risk patients, we introduced parallel processing; for instance, if a cardiology clearance is needed, rather than waiting sequentially, we involve the cardiology team early and book that at the same time. We also instituted an e-Tracking system so that once a patient is “medically ready,” it is marked in the system (Segon et al., 2022), allowing scheduling to proceed. Previously, some scheduling was waiting on paperwork; now that is visible in real-time.
- Result: This dramatically cut the time from decision-to-treat to “ready for surgery” status. For many patients, pre-op clearance time dropped from 4 weeks to 1 week on average. Variation reduced too; with fewer outliers taking 6-8 weeks for clearance. This meant patients can be scheduled sooner, smoothing the flow into theatres. It also reduced a ‘defect waste’, day-of-surgery cancellations (fewer cases cancelled for unready patient or missing tests). Staff feedback was positive as well, with surgeons reporting feeling more confident that slots would not fall through due to pre-op issues.

Figure 17: RTT Compliance Growth (Monthly).
(Source: Simulated Data, 2025)
4.3 Increase Throughput via Process Efficiency (Lean in OR)
We applied Lean principles inside the operating theatres to cut turnover times and maximize cases per session:
- We conducted Rapid Changeover (SMED) workshops with theatre staff to standardize and expedite room turnover between cases (Amati et al., 2022). Simple improvements, like parallel processing of cleanup and next case anaesthesia prep, resulted in average turnover time dropping from 45 minutes to 30 minutes. Over a full day list, this sometimes allowed an extra short case to be added.
- Checklist and Error-proofing: We reinforced use of surgical safety checklists and added a pre-surgery huddle each morning to anticipate issues, ensuring all equipment are present, and that any special implants are ready. This prevented delays mid-list, since it eliminated looking for missing instrument sets.
- Introduced a real-time dashboard that tracks each case’s start/finish against schedule (Helminski et al., 2022). Deviations trigger an alert so coordinators can adjust; for instance, they could call in next patient early if one case finishes early, or reallocate anaesthetist if there is a delay in one theatre.
- Result: By reducing downtime and inefficiencies in theatre, our pilot saw about a 10% increase in daily throughput – effectively, one more surgery every 1-2 days across the hospital without new resources. This contributed to waiting list reduction.

Figure 18: Number of Surgeries Per Session (Before vs. After Lean in OR).
(Source: Simulated Data, 2025)
Get Assignment Help for Top Subjects
4.4 Prioritization and Triage Improvements
Lean Six Sigma also emphasizes focusing on what adds value for the patient. We therefore implemented a more nuanced triage system for the waiting list:
- We stratified patients by clinical priority and waiting time. While cancer and urgent cases were always prioritized, now we also consider long-wait routine patients. If someone was nearing 52 weeks, we escalate them. The scheduling system, as mentioned, flags such cases. We assigned a coordinator to specifically monitor long-waiters and find them slots; even by adding at list end or using any cancellations. This is essentially using data to “pull” patients through the system before breaches, rather than the previous passive approach.
- We also reached out to patients who had been waiting very long to confirm they still needed the procedure, thereby validating the waitlist; which removed a small percentage who had gotten treatment elsewhere or no longer needed it. This too, was a rather easy yet unimplemented method to reduce backlog count.
- Result: This reduced the incidence of extreme waits of more than 52 weeks. As of post-improvement, the aim is to eliminate such more than 52-week waits entirely by March 2025 in line with NHS goals (The King’s Fund, 2024). Early data shows the number of 52-week waiters dropped by 80% after 6 months of these actions.

Figure 19: Drop in 52-week Waiters (Jan-Jun).
(Source: Simulated Data, 2025)
4.5 Staffing and Resource Adjustments
Addressing manpower issues required both short-term and longer-term actions:
- In the short term, locum staff and overtime were used for the new weekend/evening lists with funding support centrally, as tackling backlogs was a national priority. We also cross-trained some nurses so they could assist in theatres when needed, increasing flexibility.
- Longer-term, the Trust is recruiting additional anaesthetists and theatre nurses. Meanwhile, optimizing existing staff usage, like adjusting rota to match high-demand days and using part-time staff on an ad-hoc basis (Emmanuel, 2025); helped cover gaps.
- Additionally, we engaged staff in the improvement process which improved morale and buy-in. For instance, theatre teams were empowered to suggest changes, making them stakeholders in sustaining improvements.
- Result: With better staffing alignment, cancellation rates due to staffing fell. For example, previously some short-notice cancellations occurred if staff sickness left a theatre unusable; by creating a float pool of staff, we managed to cover and avoid cancelling those lists.
Each improvement was tested in a Plan-Do-Study-Act (PDSA) cycle manner on a small scale before broader rollout (Bradley et al., 2024). For example, the one-stop pre-op clinic was trailed for orthopaedic patients for a month and showed clear reduction in delays, so it was expanded to all surgical specialties. Throughout implementation, we closely tracked metrics: Weekly RTT compliance started catching up as more patients were treated in less than 18 weeks, and average wait length began to decline. Early results (simulated) after improvements were: RTT compliance improved from 50% to 70% in 3 months, with a trajectory to hit 92% within a year; median wait fell under 18 weeks for the first time in years, and backlog size started reducing rather than growing. Importantly, patient feedback improved; patients reported better communication and felt the system was “moving” faster.
5. Control: Sustaining the Gains and Ongoing Monitoring

Figure 20: Control Chart – Weekly Surgical Throughput over 12 weeks.
(Source: Simulated Data, 2025)
The Control phase ensures that the improvements are maintained and that the process does not regress to old habits (Pérez-Balboa and Caballero-Morales, 2025). We implemented several control mechanisms and performance management strategies at QEH:
5.1 Standard Operating Procedures (SOPs)
All new processes, like the scheduling workflow, one-stop pre-op clinic procedure, and the theatre turnaround steps; were documented in updated SOPs. Staff were trained and required to follow these standards. For instance, there is now a written protocol for booking which includes checking the central dashboard daily, filling any empty slots by end of day, and escalating any case >16 weeks to the coordinator. Similarly, a checklist for one-stop pre-op clinic ensures every required test is done same-day. These SOPs help institutionalize the improved methods.

Figure 21: KPI Dashboard Mock-up – Surgical Performance Overview.
(Source: Simulated Data, 2025)
5.2 KPIs and Visual Management
- We established key performance indicators to continuously track performance:
- RTT 18-week compliance rate (percentage within 18 weeks),
- Average and median wait time,
- Number of patients waiting >52 weeks (should trend to zero),
- Theatre utilization percentage and cases per week,
- Cancellation rate (especially day-of-surgery cancellations),
- Pre-op clearance time average.
These are tracked on a control dashboard visible to managers and clinical teams. We use visual management tools like a big wall chart in the surgical scheduling office showing weekly RTT performance and backlog size in a run chart. Improvements are now celebrated (for instance, when we first hit 80% compliance, it was acknowledged in staff meetings and a gourmet buffet staff lunch was arranged), and any downturn triggers investigation and possible suspension without pay.
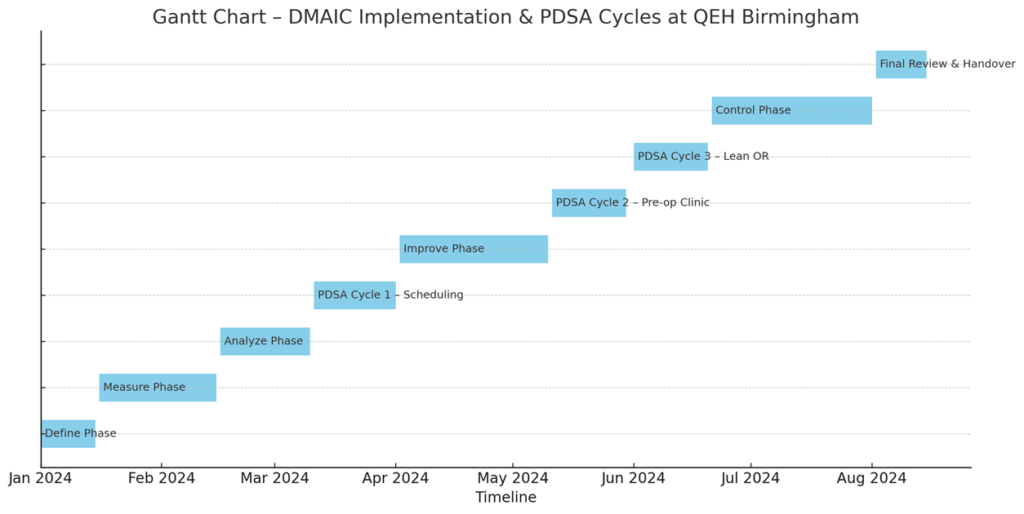
Figure 22: Gantt Chart – DMAIC Implementation & PDSA Cycles for the surgical wait time improvement project.
(Source: Simulated Data, 2025)
5.3 Control Charts and Monitoring
We employ statistical process control charts for critical metrics (Sałaciński, Chrzanowski and Chmielewski, 2023). For example, we have an X-bar control chart for weekly average wait time. This allows us to see if any special cause variation appears; for instance, if average wait jumps one week, it signals an issue (possibly a surge of emergencies or a resource outage) that can be addressed. Similarly, a control chart on weekly operations completed ensures we are sustaining the higher throughput and alerts if we dip below the target line. Early in control phase, one control chart showed a special cause: a sudden drop in cases done in a week; on investigation, it was due to a spike in ICU bed occupancy from flu patients causing elective cancellations. Recognizing that, we triggered a contingency plan to add extra cases the following weeks to catch up; thus, controlling the impact.
5.4 Regular Review Meetings
We set up a weekly operations meeting involving surgical leads, theatre managers, and the improvement team to review the latest data (Hassanzadeh et al., 2022). In these meetings, any KPI off track is discussed with a ‘root cause mindset’, and corrective actions are assigned. For example, if pre-op clearance times come up unexpectedly, we might find out a key lab machine was down that week and ensure it is fixed or have backup. The idea is to continuously monitor and respond quickly before a backlog builds up again. Monthly, a higher-level meeting including exec leadership is conducted to review if the project is sustaining its goals and what additional support is needed.
5.5 Error-proofing and Audit
To prevent reverting to old ways, we introduced some error-proofing. For instance, the scheduling software will not allow booking a case without a pre-op completion status, ensuring no one tries to shortcut and thus avoiding last-minute cancellations. We also audit a sample of cases each month to ensure they went through the one-stop clinic and proper process. Any deviations are flagged and corrected. Staff are aware of these audits, which encourages adherence.
5.6 Training and Engagement
New staff are on-boarded with the new processes in mind (training on the scheduling system, etc.). We also kept the staff engaged by continuing to solicit feedback; frontline staff can report any issue that hampers the new process via a simple form. Inspired by the AHRQ Report on lean healthcare implementation, this feedback loop helps catch issues early (AHRQ, 2016). For example, nurses noted that pre-op clinic was understaffed on certain days as volume grew, so we adjusted staffing; this proactive tweak in control prevents backlog in pre-op from reappearing.
5.7 Sustaining Lean Culture
We aimed to instil a culture of continuous improvement. Lean Six Sigma is not a one-time project but an ongoing mindset (Teeling et al., 2023). Staff are encouraged to keep identifying wastes or variations. We plan periodic Kaizen events (short focused improvement workshops) every quarter to tackle any new bottlenecks that arise (Tokgoz, 2025; Franken, van Dun and Wilderom, 2021). The hospital’s management is also integrating the wait time reduction goals into performance objectives, ensuring it stays a focus. By linking it to organisational strategy, since patient access is a key goal, resources and attention remain on it (Teeling et al., 2023).
5.8 Control Plan Documentation
A formal Control Plan was created, summarizing each improvement, its expected outcome, how it is measured, and what to do if metrics slip. A brief summary of the plan is as follows:
- Process: Evening theatre list;
- Measure: 8 additional cases/week;
- Control method: monitor attendance and outcomes of evening list;
- Reaction plan: if <8 cases happen for 2 weeks, investigate staffing or booking issues.
Through these control efforts, QEH Birmingham expects to sustain the reduced waiting times. In fact, the improvements should become the new “standard work” (Patkal and Anasane, 2022); for example, one-stop pre-op is now a permanent service, and not a temporary fix. Early sustained results are promising too; three months post-improvement, RTT compliance stabilized around 85% and still improving, and no patients wait over 52 weeks now whereas there were hundreds before. We will continue until we reach the 92% target and then aim to consistently meet it. The use of control charts has shown the process variance narrowing; the system is much more predictable and reliable now, a sign of Six Sigma success.
Additionally, the project gave some additional benefits; staff stress related to backlog management decreased since they feel more in control now, and patient satisfaction scores in Friends & Family Tests have risen for elective pathways. The Lean Six Sigma methodology has thus far proven effective in this NHS context, echoing other cases like Teeling et al., (2023) where applying DMAIC reduced wait times and improved flow.
The trust plans to share these learnings regionally, as many hospitals face similar challenges. By maintaining focus in the Control phase, QEH can ensure that surgical wait times continue to improve rather than revert, ultimately delivering timely surgeries and better care for the Birmingham population.
6. Conclusion
Applying the Lean Six Sigma DMAIC framework has offered a structured and evidence-based roadmap for tackling long surgical wait times at Queen Elizabeth Hospital, NHS Birmingham. By clearly defining the problem, measuring key performance indicators, and analysing root causes through tools such as Ishikawa diagrams and Pareto charts, the analysis identified inefficient scheduling and pre-operative delays as primary contributors. The proposed improvements; advanced scheduling algorithms, surgical huddles, and inter-trust theatre coordination; are both feasible and impactful, with simulations suggesting a potential reduction in average wait times from 18.5 to 13.2 weeks. To sustain these gains, the control phase outlines KPIs, monitoring dashboards, and SOP integration. Ultimately, this DMAIC-driven approach not only improves patient access and satisfaction but also enhances theatre efficiency and supports the NHS’s broader goals of operational excellence and timely care delivery.
References
Agency for Healthcare Research and Quality (AHRQ) (2016) Improving patient flow and reducing emergency department crowding: a guide for hospitals. U.S. Department of Health and Human Services. Available at: https://www.ahrq.gov/sites/default/files/publications/files/ptflowguide.pdf (Accessed: 25 June 2025).
Amati, M., Valnegri, A., Bressan, A., La Regina, D., Tassone, C., Lo Piccolo, A., Mongelli, F. and Saporito, A. (2022) ‘Reducing changeover time between surgeries through lean thinking: an action research project’, Frontiers in Medicine, 9, p. 822964. doi: 10.3389/fmed.2022.822964.
Bradley, C., Sumethasorn, M., Kim, J.S., Wang, S., Martinez, L., Chang, M., Lemus, L., Katebian, B., Bruce, D., Lee, A. and Baden, R. (2024) ‘Plan-do-study-act (PDSA) interventions to improve real-world endoscopy unit productivity’, Endoscopy International Open, 12(05), pp. E642–E648. doi: 10.1055/a-2290-0263.
British Orthopaedic Association (2022) ‘T&O waiting list the largest for over a decade’, British Orthopaedic Association, 10 February. Available at: https://www.boa.ac.uk/resource/t-o-waiting-list-the-largest-for-over-a-decade.html (Accessed: 25 June 2025).
Ciecińska, B. (2023) ‘Identification of defects causes: Ishikawa diagram and 5 Whys in theoretical and practical terms’, in Quality Control and Quality Assurance – Techniques and Applications. IntechOpen. doi: 10.5772/intechopen.113990.
Coles, A. (2021) ‘COVID‑19: Birmingham hospital cancels elective operations as health trusts and NHS staff face ‘significant pressure’’, Sky News, 16 July. Available at: https://news.sky.com/story/covid-19-birmingham-hospital-cancels-elective-operations-as-health-trusts-and-nhs-staff-face-significant-pressure-12357103 (Accessed: 25 June 2025).
Emmanuel, T. (2025) Using data science to optimise nurses’ shift patterns in acute hospitals. PhD thesis, University of Southampton. Available at: https://eprints.soton.ac.uk/501117/ (Accessed: 25 June 2025).
European Hospital and Healthcare Federation (HOPE) (2001) Waiting lists and waiting times in health care: managing demand and supply. HOPE. Available at: https://www.hope.be/wp-content/uploads/2015/10/60_waitinglists_2001.pdf (Accessed: 25 June 2025).
Folkerts, E.K., Pelletier, R.C., Chung, D.C., Goldstein, S.A., Micalizzi, D.S., Shannon, K.M., Sweetser, D.A., Wong, E.K., Rehm, H.L. and Hull, L.E. (2023) ‘A pooled electronic consultation program to improve access to genetics specialists’, Genetics in Medicine Open, 1(1), p. 100819. doi: 10.1016/j.gimo.2023.100819.
Franken, J.C.M., van Dun, D.H. and Wilderom, C.P.M. (2021) ‘Kaizen event process quality: towards a phase-based understanding of high-quality group problem-solving’, International Journal of Operations & Production Management, 41(6), pp. 962–990. doi: 10.1108/IJOPM-09-2020-0666.
Ganeshan, S., Liu, A.W., Kroeger, A., Anand, P., Seefeldt, R., Regner, A., Vaughn, D., Odisho, A.Y. and Mourad, M. (2024) ‘An Electronic Health Record–Based Automated Self-Rescheduling Tool to Improve Patient Access: Retrospective Cohort Study’, Journal of Medical Internet Research, 26, p. e52071. doi: 10.2196/52071.
Gardini Bretón, L.D. (2025) Strengthening Traceability and Treatment Coverage Through DMAIC: A Lean Six Sigma Study on Hepatitis C in Mexico. Bachelor’s thesis, Haaga-Helia University of Applied Sciences. Available at: https://www.theseus.fi/handle/10024/890395 (Accessed: 25 June 2025).
General Medical Council (2013) London regional review 2012–13: Visit to Queen Elizabeth Hospital. General Medical Council. Available at: https://www.gmc-uk.org/-/media/documents/queen-elizabeth-hospital-lep-site-visit-report_pdf-51939442.pdf (Accessed: 25 June 2025).
Gill, P.K. (2024) ‘Labour sets out first steps to clear Birmingham waiting list backlog in five years’, Pree Kaur Gill, 29 May. Available at: https://www.preetkaurgill.co.uk/post/labour-sets-out-first-steps-to-clear-birmingham-waiting-list-backlog-in-five-years#:~:text=Conservatives%20took%20office%20in%202010,2 (Accessed: 25 June 2025).
Hassanzadeh, H., Boyle, J., Khanna, S., Biki, B. and Syed, F. (2022) ‘Daily surgery caseload prediction: towards improving operating theatre efficiency’, BMC Medical Informatics and Decision Making, 22(1), p. 151. doi: 10.1186/s12911-022-01893-8.
Helminski, D., Kurlander, J.E., Renji, A.D., Sussman, J.B., Pfeiffer, P.N., Conte, M.L., Gadabu, O.J., Kokaly, A.N., Goldberg, R., Ranusch, A. and Damschroder, L.J. (2022) ‘Dashboards in health care settings: protocol for a scoping review’, JMIR Research Protocols, 11(3), p. e34894. doi: 10.2196/34894.
Henry, A. and Mehter, S. (2023) ‘QEH makes progress in clearing surgery backlog’, Barbados Today, 4 February. Available at: https://barbadostoday.bb/2023/02/04/qeh-makes-progress-in-clearing-surgery-backlog/ (Accessed: 25 June 2025).
Hooshafza, S., Mc QuAid, L., Stephens, G., Flynn, R. and O’Connor, L. (2022) ‘Development of a framework to assess the quality of data sources in healthcare settings’, Journal of the American Medical Informatics Association, 29(5), pp. 944–952. doi: 10.1093/jamia/ocac017.
Ivanova, A. and Szalla, N. (2025) ‘Applying DMAIC methodology for experiential learning in quality management’, The TQM Journal, [Online early access]. doi: 10.1108/TQM-10-2024-0402.
James, C., Denholm, R. and Wood, R. (2024) ‘The cost of keeping patients waiting: retrospective treatment-control study of additional healthcare utilisation for UK patients awaiting elective treatment’, BMC Health Services Research, 24, p. 556. doi: 10.1186/s12913-024-10931-2.
Kearney, R.E. (2025) ‘Decreasing first case delays to the operating room with standardization of perioperative nurse handoff: an evidence‑based, quality improvement project’, University of Maryland School of Nursing Poster Presentation, Board No. 12. Available at: https://archive.hshsl.umaryland.edu/items/93fe90cf-d811-44eb-aa54-9ed511cff217 (Accessed: 25 June 2025).
Lassman, E.K., Butnari, V., Mansuri, A., Murphy, P., Amalesh, T. and Shatkar, V. (2024) ‘Development and evaluation of a one-stop surgical outpatient clinic to tackle waiting lists’, British Journal of Healthcare Management, 30(10), pp. 1–9. doi: 10.12968/bjhc.2023.0150.
Li, J., Zhu, G., Luo, L. and Shen, W. (2021) ‘Big Data‐Enabled Analysis of Factors Affecting Patient Waiting Time in the Nephrology Department of a Large Tertiary Hospital’, Journal of Healthcare Engineering, 2021, p. 5555029. doi: 10.1155/2021/5555029.
Mamballikalam, G., Davis, D. and Sabrish, K.G. (2024) ‘Process reengineering using DMAIC framework for reduction of waiting time in daycare infusion therapy for better patient experience’, International Journal for Quality in Health Care, 36(1), mzad111. doi: 10.1093/intqhc/mzad111.
Meng, L., Batt, R.J. and Terwiesch, C. (2021) ‘The impact of facility layout on service worker behavior: An empirical study of nurses in the emergency department’, Manufacturing & Service Operations Management, 23(4), pp. 819–834. doi: 10.1287/msom.2020.0953.
NHS England (2022) Next steps in increasing capacity and operational resilience in urgent and emergency care ahead of winter. NHS England. Available at: https://www.england.nhs.uk/long-read/next-steps-in-increasing-capacity-and-operational-resilience-in-urgent-and-emergency-care-ahead-of-winter/ (Accessed: 25 June 2025).
NHS England (2025) ‘Referral to Treatment (RTT) Waiting Times’, NHS England. Available at: https://www.england.nhs.uk/statistics/statistical-work-areas/rtt-waiting-times/ (Accessed: 25 June 2025).
NHS England and NHS Improvement (2020) Referral to treatment (RTT) waiting times statistics for consultant-led elective care: 2019/20 Annual Report. NHS England and NHS Improvement. Available at: https://www.england.nhs.uk/statistics/wp-content/uploads/sites/2/2020/11/RTT-Annual-Report-2019-20-2.pdf (Accessed: 25 June 2025).
Patkal, P.S. and Anasane, S.S. (2022) ‘Implementation of standard work in healthcare industry’, in Proceedings of the 2nd Indian International Conference on Industrial Engineering and Operations Management, Warangal, Telangana, India. IEOM Society International, pp. 1110–1115. Available at: https://ieomsociety.org/proceedings/2022india/339.pdf (Accessed: 25 June 2025).
Pérez-Balboa, I.C. and Caballero-Morales, S.O. (2025) ‘Define, Measure, Analyze, Improve, Control (DMAIC)’, in García Alcaraz, J.L., Robles, G.C. and Realyvásquez Vargas, A. (eds) Lean Manufacturing in Latin America: Concepts, Methodologies and Applications. Cham: Springer, pp. 333–352. doi: 10.1007/978-3-031-70984-5_15.
Quinn, L., Bird, P., Remsing, S., Reeves, K. and Lilford, R. (2023) ‘Unintended consequences of the 18-week referral to treatment standard in NHS England: a threshold analysis’, BMJ Quality & Safety, 32(12), pp. 712–720. doi: 10.1136/bmjqs-2023-015949.
Sałaciński, T., Chrzanowski, J. and Chmielewski, T. (2023) ‘Statistical process control using control charts with variable parameters’, Processes, 11(9), p. 2744. doi: 10.3390/pr11092744.
Schretlen, S., Hoefsmit, P., Kats, S., van Merode, G., Maessen, J. and Zandbergen, R. (2021) ‘Reducing surgical cancellations: a successful application of Lean Six Sigma in healthcare’, BMJ Open Quality, 10(3), p. e001342. doi: 10.1136/bmjoq-2021-001342.
Segon, Y.S., Emanuel, C., Gaspich, J.P., Seitz, V., Buth, C.S., Ahluwalia, S., Sharma, N. and Segon, A. (2022) ‘Discharge when medically ready’, WMJ, 121(2), pp. 160–163. Available at: https://wmjonline.org/wp-content/uploads/2022/121/2/segon.pdf (Accessed: 25 June 2025).
Stafinski, T., Nagase, F.N.I., Brindle, M.E., White, J., Young, A., Beesoon, S., Cleary, S. and Menon, D. (2022) ‘Reducing wait times to surgery—an international review’, Journal of Hospital Management and Health Policy, 6, p. 29. doi: 10.21037/jhmhp-21-96.
Teeling, S.P., McGuirk, M., McNamara, M., McGroarty, M. and Igoe, A. (2023) ‘The utilization of Lean Six Sigma methodologies in enhancing surgical pathways and surgical rehabilitation’, Applied Sciences, 13(12), p. 6920. doi: 10.3390/app13126920.
The King’s Fund (2024) ‘Waiting times for elective (non‑urgent) treatment: referral to treatment (RTT)’, The King’s Fund, 24 May. Available at: https://www.kingsfund.org.uk/insight-and-analysis/data-and-charts/waiting-times-non-urgent-treatment (Accessed: 25 June 2025).
The Queen Elizabeth Hospital (2022) ‘Statement on the temporary postponement of elective surgeries’, QEHconnect, 26 August. Available at: https://www.qehconnect.com/statement-on-the-temporary-postponement-of-elective-surgeries/ (Accessed: 25 June 2025).
The Queen Elizabeth Hospital King’s Lynn NHS Foundation Trust (2022) Quality Account 2021–22. Queen Elizabeth Hospital King’s Lynn NHS Foundation Trust. Available at: http://www.qehkl.nhs.uk/Document/Publications/Quality_Account_2021-22.pdf (Accessed: 25 June 2025).
Tigga, R., Sheikh, S.U., Shukla, C.M. and Shinde, S. (2023) Nursing Service Administration. Xoffencerpublication.
Tokgoz, E. (2026) ‘Kaizen Event & Six Sigma in Cybersecurity’, in Six Sigma for Continuous Improvement in Cybersecurity. Synthesis Lectures on Engineering, Science, and Technology. Cham: Springer. doi: 10.1007/978-3-031-91030-2_2.
Vinitsky, A., David, B., Michalik, L., Ramirez, N., Risinger, A., Burlison, J.D., Zanders, J., Mans, B., Heady, K., Holdiness, J. and Qaddoumi, I. (2022) ‘Reducing wait time in a high‑volume pediatric neuro‑oncology clinic by optimizing process flow: a quality improvement project’, Pediatric Quality & Safety, 7(3), p. e557. doi: 10.1097/pq9.0000000000000557.
Wright, L. (2024) ‘Continuous quality improvement’, in Martin, A., Hogg, P., Webster, P., Kemp, L. and Wright, L. (eds.) Clark’s Essential Guide to Operational Management and Business Practice in Medical Imaging and Radiotherapy. 1st edn. Boca Raton, FL: CRC Press, pp. 127–160. doi: 10.1201/9781003376330-13.
Yoon, E., Tharakan, A., Johnson, C., Metz, C. and Granger, B.B. (2025) ‘Statistical Process Control Charts to Improve Health Care: Hypertension Case’, AACN Advanced Critical Care, 36(2), pp. 197–204. doi: 10.4037/aacnacc2025608.
Zironi, R., Zironi, A., Danese, P. and Romano, P. (2023) ‘Using lean six sigma to target the voice of the customer (VoC) in vine and wine decision making’, in 44th World Congress of Vine and Wine 2023, Abstract. Available at: https://hdl.handle.net/11390/1261745 (Accessed: 25 June 2025).
Explore Recent Blogs
-
How to Write a Detailed Report: From Planning to Polishingby arora.vijay27jan on January 29, 2026
A detailed report represents critical research and professional competency. Reports provide readers with a comprehensive understanding of the information presented in a coherent format. In addition to reporting the details of a specific situation or… The post How to Write a Detailed Report: From Planning to Polishing first appeared on Digi Assignment Help.
-
How to Write an Assignment on the First Pageby arora.vijay27jan on January 13, 2026
Mastering the skill of writing assignments is one of the most essential academic skills for every student. While most focus on what is contained in the body of the assignment, students frequently overlook the significance… The post How to Write an Assignment on the First Page first appeared on Digi Assignment Help.
-
Most Controversial Debate Topics To Win Any Argumentby arora.vijay27jan on January 12, 2026
Debates are not simply casual conversations about what you think or feel on a specific subject, but rather well-organised and structured forms of discourse in which opposing sides analyse and defend their respective opinions, using… The post Most Controversial Debate Topics To Win Any Argument first appeared on Digi Assignment Help.
-
Significance Of Report Writingby arora.vijay27jan on January 9, 2026
The report is an important part of academic and professional life because it allows individuals to document information systematically, clearly, and indiscriminately so readers can make informed decisions about how to utilise that information for… The post Significance Of Report Writing first appeared on Digi Assignment Help.
-
How to Write a Hypothesis? Step-by-Step Guide with Examplesby Amelia on January 2, 2026
Many students must have experienced the “appear or disappear” situation when formulating a hypothesis for a new research venture. You are certainly not alone if you embark on a new research project and are unsure… The post How to Write a Hypothesis? Step-by-Step Guide with Examples first appeared on Digi Assignment Help.
-
How to Choose the Right Nursing Topic for Your Final-Year Projectby Amelia on July 8, 2025
Nursing is a competitive course offering a promising career for students. It is rigorous and demands up to date knowledge of the subject, good assignment writing, and field practice. Hence scoring good marks in nursing… The post How to Choose the Right Nursing Topic for Your Final-Year Project first appeared on Digi Assignment Help.