ASSESSMENT COVER SHEET
This cover sheet must be completed and submitted with all work including essays, Dissertations and practical work (with the exception of oral assessments). Please ensure that you complete it in FULL indicating the Unit Title and Unit Code (these can be found in your course guide and on the project briefs) and Word Count.
You must attach this form to your work.
| Surname:- 1.Kaur 2.Kaur 3.Bhambhu | First Name:- GROUP 3:- 1.Gurpreet 2..Ravinderjeet 3.Rahul |
| Unit Title:-Digital Marketing Analysis. | Unit Code:-EBSC5150 |
| Project/Component/Essay/Dissertation Title:- Digital marketing consultancy report for Google Merchandise Store | |
| Course:-BA/BSC(hons) Business and management. | Unit Leader:- Dr.Jing Zhong,Shawn li |
| Year of Study (e.g. 1st/2nd etc.) :-2 | Submission Date:-21 January |
For written work (essay, dissertation) please also confirm:
| Word Count 1940 | ||
| Use of proof-reader/proof-reading service (see guidance contained in Academic Misconduct Regulations on appropriate use) | YES | NO |
| If ‘yes’, please specify which service (e.g. Grammarly, Studiosity, etc.) | ||
| I confirm that I submit this work as my own work and that I have cited all sources I have used, and I understand that using sources without citing them correctly may be considered as Academic Misconduct. | YES | NO |
| I confirm that I have followed guidance on the acceptable use of AI tools for this assignment where such guidance has been issued by my tutors. | YES | NO |
| Where use of appropriately cited use of AI tools is permitted, I confirm that I have cited in accordance with the UCA Harvard Referencing Standard. | YES | NO |
For practical work please also complete:
| Describe the type and volume of work you are attaching (e.g. 1 x journal, 4 x images) | Received by: Staff initials | |
By submitting this assessment you are confirming that you have understood and are complying with the University’s Academic Misconduct Regulations (available to view under Student Regulations on myUCA).
Plagiarism Detection (Turnitin)
UCA uses Turnitin (an on-line text matching tool) to help identify cases of plagiarism. Turnitin will compare a submitted assignment with a database of journal articles, books, web pages and previously submitted assignments. For more information on plagiarism and Academic Integrity please see: https://mylibrary.uca.ac.uk/friendly.php?s=academicintegrity
Signature (Student): Gurpreet kaur Date: 20/jan/2025.
EBCS5150
Digital Marketing Analytics
TERM 1
Summative Assessment
Executive Summary
This report outlines an assessment of the Google Merchandise Store or (GMS) e-marketing for the year 2024 with Regards to its traffic sources, user interactions, Conversion rates and revenue income. There are many significant findings about GMS that can be understood from the case analysis with a focus on weak points and opportunities for enhancement and progression across devices, audiences, and regions.
Metrics show that although desktop offers satisfactory statistics, a combination of page views and average visit length show that mobile has a poor interaction rate. When it comes to the market share, the USA, which together with the countries where English is spoken, constitute a large number of visits and sales, there is clearly a potential for additional targeted initiatives. Besides, there is a trend towards lower AEL and Conversion Rate between Mobile/Tablet users and Desktop users.
Some of the measures that can be used to increase the mobile interactions include better and improved mobile experience, quipped mobile touch, and improved per user marketing strategies. The significantly enhanced operating ratio for the United States and English-speaking regions imply that much more localized content and publicity might be transforming into these regions.
Introduction
This digital marketing audit examines the performance of the digital marketing channels for the Google Merchandise Store (GMS) for the year 2024. With this audit, the discussion will perform an in depth analysis of many data sets in order to provide valuable insights on how users behave, how engaged users are, how revenue is generated, etc. It is expected that the goal of this study is identifying the strengths and weaknesses of GMS’s digital marketing strategy and take action for their performance improvement.
The following key data categories will be analyzed, including user overview, demographic (by country, language and gender), device usage and platform engagement. The audit analyzes the data points to uncover such trends and patterns as they can be a significant influence on the marketing decisions. For example, the audit will be dedicated to user acquisition and retention rates, session duration, revenue per user, and identify digital channel performance (desktop, mobile). The report further scrutinizes geographical and demographic factors that may determine overall marketing success and which platforms, such as web browsers or operating systems, are generating the most traffic and conversions. In the conclusion of this audit, strategic recommendations are provided aiming to optimize GMS’s digital presence to drive long term growth.
Evaluation
User Overview
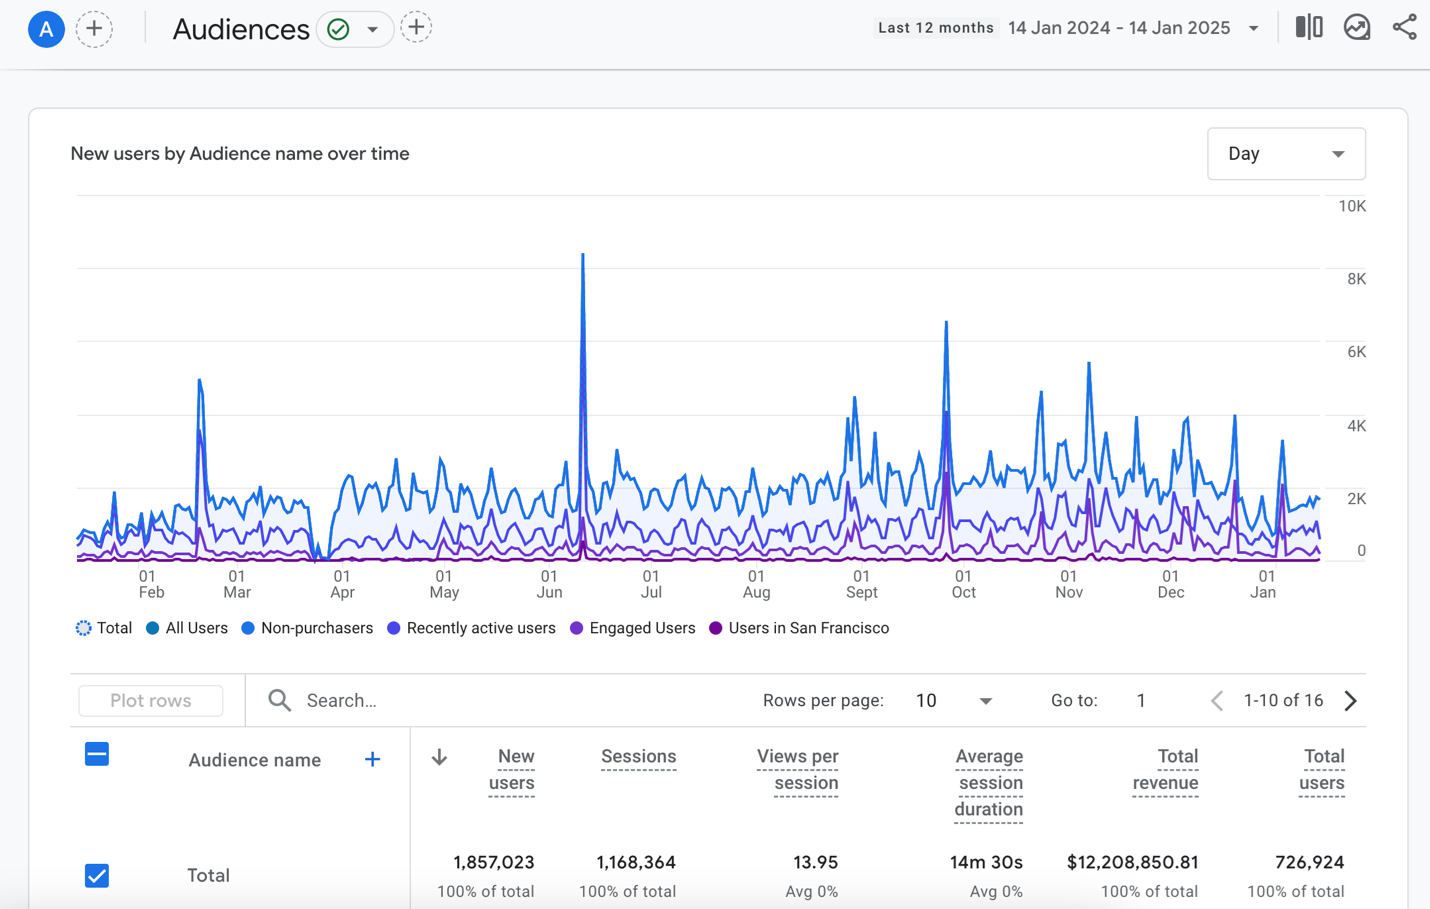
Figure 1: Audience Overview
The user overview agendas offer a general idea about the Google Merchandise Store (GMS) that emphasizes a blended demographic. This means that users give enough of their attention to the platform; more specific, there are many views per session. This indicates that the users are fairly responsive, perhaps because they have many options and good Internet advertising. Converting visitors into revenue that is the main purpose of such platforms is done quite successfully and without any noticeable flaws.
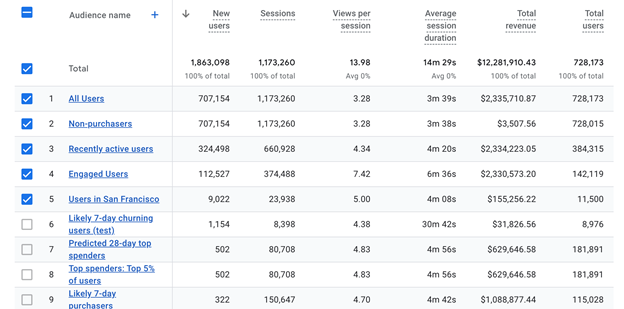
Figure 2: Audience Overview
However, when thinking in terms of session behavior it is possible to observe a direct link between the activity of users and the revenues. User interaction is high with an average of 3.28 views per visit showing that users have more than one point of interest or, are interested in more than one product line or content during a single visit. The fact that the average session of 14 minutes 30 seconds also underlines this showing that GMS’s website content and navigation together with the flow of the site do grab and hold users’ attention. This level of activity is good signal that they are not simple visitors, but rather committed users engaged with the content, which is important for any revenue model.
Furthermore, the metrics associated with high engagement rates and decent revenues involved reflect the fact that GMS has been targeting right users, who are eager to dig deeper to the site and make the purchase. However, it is possible to improve such targeting even more when considering potential ‘new’ customers or by aiming at the enhancement of the repeat purchase rates through the mechanics of the adjuster and personalization of the marketing and offers, which is presented in more detail in the further sections of the analysis.
Feeling Overwhelmed By Your Assignment?
Get assistance from our PROFESSIONAL ASSIGNMENT WRITERS to receive 100% assured AI-free and high-quality documents on time, ensuring an A+ grade in all subjects.
Demographic Analysis
i. Country
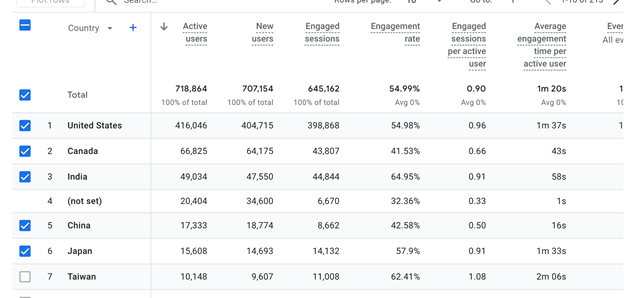
Figure 3: Demographic Details: Country
These results show that users’ demographic data analysis means that the United States is ahead of other countries according to active users and average session and revenue. The U.S revealed high user engagement and high conversion rate thus proving the effectiveness of localized marketing program for this market. However, there is an exception with nations like India and Canada where users display different patterns. In terms of activity, for example, we see that Indian users are very active; however, the level of buying is much lower in comparison with such countries as the USA and Canada. This means that there is need to focus on specific niches that understands consumer channel and economic peculiarities within these areas. Likewise, while Canadian traffic produces fewer orders than the traffic originating from the United States, users from the former tends to spend comparatively more per order. This points to the possibility of an enhanced conversions through optimizing the user interface and expanding the advertising efforts to ensure it meets the Canadian users’ needs and expectations.
Top UK Assignment Samples
ii. Language
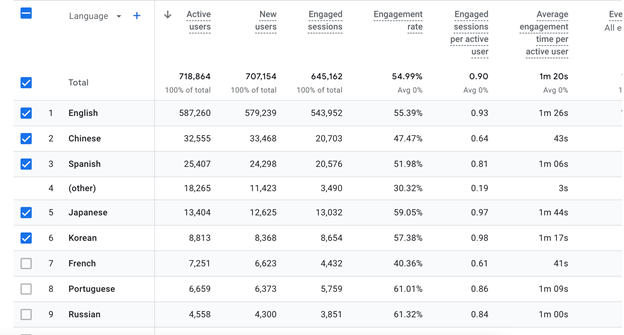
Figure 4: Demographic Details: Language
Language affects how the users are able to interact and the amount of revenues generated by the platform. English being the most widely used language with more active users and high engagement most probably due to the material being highly applicable to those who understand English. Other languages which have relatively good engagement include Chinese and Spanish languages but have relatively poor conversion rate and revenue compared to English. This implies that in implementing the website there may be shortcomings in the way they design and adapt the content and or marketing campaigns to the audience that does not understand English.
Other languages also show fairly good participation and comparatively stable monotonous revenues, hence considered having great growth prospects The following languages: Languages such as Japanese, Korean and Portuguese also reflect high comparative engagement and stable monotonous revenue deficits. However, these findings suggest that enhanced localized approaches should be applied, for instance increasing the site’s accessibility to people with little understanding of English and better matching the product portfolios to cultural or regional demands. Perhaps, expanding the company’s marketing efforts and communicating messages that are culturally relevant may help increase trust which in turn would result in higher sales conversion rates. All in all, the interaction dynamics whit these languages are promising, however, there is much potential in terms of tuning the content, improving the funnel and extending the multicultural audience interest to the platform.
iii. Gender
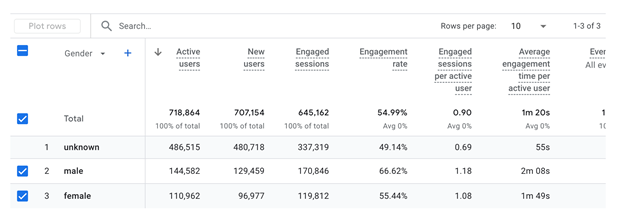
Figure 5: Demographic details: Gender
It is now important to review pertinent findings that compare and contrast gender and the behavior of the users. Here too male users are even more interactive with the content with even higher reaction rates and longer sessions on the website. This has an implication that new generation products favour male audiences more in terms of engagement and commitment. Despite their fewer presence in the application, the Body Deposits: female users generate a considerable amount of sales revenue consistently express interest in the application. Proposed by their reading engagement statistics which although slightly lower than that of male participants, it will likely develop if for instance their existent media campaigns or product categories were more relevant to gender.
Moreover, there is a rather large percentage of users whose gender remains unknown. This absence of subdivision shows that there is not enough targeting by demographic data, and this might be discouraging the platform from meeting the various needs of the users. Solving this could be accomplished by better ways of amassing data and more segmentation which may give more associated detail about the user habits and preferences. In short, the platform does quite a good job with the male target audience and demonstrates potential associated with the female part of the platform’s user base – yet, arguments can be made that it still has a potential to fine-tune its approach with all target groups to deliver the maximum level of engagement topped up with the maximized revenue streams.
Top UK Assignment Cities
Device Category
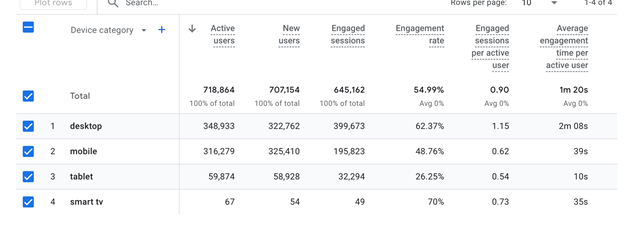
Figure 6: Tech details: Device Category
By focusing on device-based engagement for GMS, specific user activities and possible improvements are demonstrated. Among device types of desktop devices stand out regarding usage time and revenue they bring to the platform. This indicates that there are substantially better usability and browsing comfort that can be now associated with desktops while viewing catalog-oriented sites, which makes them helpful in sales. In fact, even though the traffic generated by mobile devices is impressive, the revenue that comes from them is very low. This means that, for example, problems of slow loading of pages or ineffective checkouts can reduce mobile conversions. Solving these UI/UX problems could enhance mobile interactions and bring out most of the mobile experience. Navigation and functionality of applications have the lowest engagement and revenue on scale on the tablet devices which can be attributed to this device category. It is believed that improving the navigation and the content of tablets and even the general layout of tablet-based content could lead to improved usage and interaction. They show low level of engagement but since Smart TVs have the potential of being used as media consumption, their continued growth should be watched in the future. Currently, this segment is not very important but may become important when smart TV usage comes into play. To sum up the results we conclude how crucial it is to reconsider mobile and tablet experience to enhance the work and increase conversion rate all while maintaining our strong position in desktop device and following the tendencies in other devices such as smart TV.
Recommendations
In this case the following strategies should be taken to address the underperformance in mobile engagement. However, the fact that the engagement rate and the average session duration is lower on the machines but the traffic originates from mobile devices means that the user experience on this particular platform may need assistance (Al Adwan et al., 2023). First of all, the mobile website need to be improved as for loading and navigation speed – it would substantially increase user experience. Additional features related to mobile only, for example, can include: push notifications, special offers based on the visitors’ location, individual offers on the content could help enhance visitors’ engagement which can be incorporated using the AIMRITE framework (Audience, Impact, Message, Response, Internal Management, The End result) (Husin et al., 2022). Also, existing mobile checkout barriers are identified with attempting to remove them leading to a longer average session time (Alby, 2023). There is potential in targeting high-performance demographic indicators, for instance, the US users and those who prefer using the English language. Marketing campaigns aimed at these regions can be broadened by using their content and promotions that will fit the consumers’ expectation and tendencies (Gani and Faroque, 2021). Besides, there are particular SEO approaches that could enhance the recognition of such companies and attract users from these markets (Mуkhalchenko and Tytarenko, 2023). The language targeting will be beneficial to select English as the content and ads which are showing good engagement will be given more investment to expand the user base for the same language (Cham et al., 2022). Especially in the aspect of performance as mobile and tablet has relatively lower score than that of desktop (Kundu, 2021). One of the improvements that should lead to growth in session time and engagement rates on such devices will be a responsive design that enhances usability across different screen sizes (Ijomah et al., 2024). However, specific marketing techniques such as app develop or optimizing apps that are already developed could also increase mobile commitment (Aminul, 2024).
Get Assignment Help for Top Subjects
Conclusions
In order to advance mobile response, UX must be made better for mobile users. Some of the ways through which it can be done are by allowing the mobile site to load swiftly, by making it easy for people to navigate and by making the check-out process easier. Other areas which could help boost sessions per use and engagement include including elements such as push notifications and recommended content. Marketed needs to be suited to the high-performing demographics – currently, the US and English-speaking countries, in particular. Promoting content according to the market, practicing regional incentives, and implementing strong SEO tactics will encourage people to visit these markets. Since performance on mobile and tablet devices is relatively lower as compared to others, it is critical to focus on increasing its responsivity and usability. An optimized design for the mobile devices will improve response rates and improve the usage time on these gadgets.
Top UK Assignment Samples


References
Al Adwan, A., Kokash, H., Al Adwan, R. and Khattak, A., 2023. Data analytics in digital marketing for tracking the effectiveness of campaigns and inform strategy. International Journal of data and network science.
Alby, T., 2023, April. Popular, but hardly used: Has Google Analytics been to the detriment of Web Analytics?. In Proceedings of the 15th ACM Web Science Conference 2023 (pp. 304-311).
Aminul, M., 2024. Impact of Big Data Analytics on Digital Marketing: Academic Review. J. Electrical Systems, 20(5s), pp.786-820.
Cham, T.H., Cheah, J.H., Memon, M.A., Fam, K.S. and László, J., 2022. Digitalization and its impact on contemporary marketing strategies and practices. Journal of Marketing Analytics, 10(2), pp.103-105.
Gani, M.O. and Faroque, A.R., 2021. Digital marketing. In Cross-border E-commerce marketing and management (pp. 172-202). IGI Global.
Husin, S.N., Edastama, P. and Tambunan, A., 2022. Digital Marketing Strategy using White Hat SEO Techniques. International Journal of Cyber and IT Service Management, 2(2), pp.171-179.
Ijomah, T.I., Idemudia, C., Eyo-Udo, N.L. and Anjorin, K.F., 2024. Harnessing marketing analytics for enhanced decision-making and performance in SMEs. World Journal Of Advanced Science And Technology, 6(1), pp.001-012.
Kundu, S., 2021. Digital Marketing Trends and Prospects: Develop an effective Digital Marketing strategy with SEO, SEM, PPC, Digital Display Ads & Email Marketing techniques.(English Edition). BPB Publications.
Mуkhalchenko, H. and Tytarenko, M., 2023. Data analytics and personalized marketing strategies in E-commerce platforms. Futurity Economics&Law, 3(3), pp.114-138.
Nirwana, A., 2023. Implementation of artificial intelligence in digital marketing development: A thematic review and practical exploration. Jurnal Manajemen Bisnis, Akuntansi Dan Keuangan, 2(1), pp.85-112.
Saura, J.R., 2021. Using data sciences in digital marketing: Framework, methods, and performance metrics. Journal of Innovation & Knowledge, 6(2), pp.92-102.
Vollrath, M.D. and Villegas, S.G., 2021. Avoiding digital marketing analytics myopia: revisiting the customer decision journey as a strategic marketing framework. Journal of Marketing Analytics, 10(2), p.106.