Assessment of Economic And Financial Status Of Russia And India
Executive Summary
The main focus of the assessment is to focus on the economic and financial status of two different countries. The two countries which is considered for the analysis are Russia and India and thereby the analysis considers balance of payments and trade arrangements of both the companies. The analysis would be considering trade arrangement between the two countries and the competitive advantage of both the companies.
For the purpose of assessing the international trade policies of both the countries, different factors like tariff rates, government policies, subsides which are allowed between the countries. The factors considered have a profound effect on the GDP of the countries and their financial status.
Further the analysis would be focusing on the currency values in both countries in terms of whether the same has appreciated or depreciated in terms of value from previous periods. The discussion would be consider purchasing power parity between the two nations and would make comparisons on the basis of above factors. On an overall basis, it is clear that the analysis would consider both past and present data for both countries to establish the economic and financial status which they both have in global economy.
Introduction
The main focus of the assessment is to consider the economic and financial situation of two countries which have an alliance in terms of international trade. The countries which are selected are Russia and India which is a combination of a developed nation and a developing nation respectively. For the purpose of this study, different factors are taken into account like Balance of Payments, Governmental Policies, subsidies, Tariffs for both nations. In addition to this, the study considers the purchasing power parity and currency value between the nations so that appropriate comparisons can be made. For the purpose of this study, data set is extracted from known sources for both nations so that a level of transparency is maintained in the study conducted.
Discussion
Assessment of Economic and Financial Status of the Countries
India
The Indian economy has underwent a roller-coaster of a journey from being an under developed nations to becoming one of the most promising developing countries. Considering the last decade, lots of changed in the country like populism break through, demonetization, shadow banking practices and the pandemic. The economic development in the country can be related to Scrabble Theory of economic development where emphasis is placed on know-how and technological developments, enhancing capacities, building new networks etc.
All these aspects contribute towards the competitive advantage which a nation has in global markets. The GDP numbers for the country have improved significantly over the years and it is currently at 6.9%. One of the foundations for the growth and development of the nation is the international trade with different nations. India has one competitive advantage which is a very big market as population is on the higher side. It is idle for countries who are looking to tap into new markets and draw out revenues.
Top UK Assignment Samples
Focus on International Trade
International Trade plays an important role in every economy where focus is placed on specialisation in terms of products and opens doors to new markets. The Indian economy in this last decade has focused on enhancing the export value of the country as manufacturers in India has looked to set up trade relations with other nations. In addition to this, India has been a centre where services are outsourced by other nations which has helped the country to develop competitive advantage in the global level. The export basket for India incorporates proportion of engineering goods, pharmaceuticals, and electronics goods in total exports increased. A graph presented below shows data for exports undertaken in the country:

Source: (Deloitte. 2024)
Russia:
Russia maintains strong trading relations with several of the former Soviet bloc countries and has by far the biggest and most populated economy in Eastern Europe. It was also a major energy supplier to the EU prior to the conflict in Ukraine, yet since 2022, supplies of energy to the bloc have drastically decreased. The Russian Economy provides defence and tactical support, energy, fuels and other materials to different countries which is one of the reasons that the economy has flourished over the years.
In terms of economic outlook, Services made up 63% of GDP in 2021, followed by manufacturing at 14%, other industrial activity at 19%, and agriculture at 4%. When GDP is broken down by expenditure, in 2021 net exports made up 10%, government consumption 18%, fixed investment 22%, and private consumption 50% of GDP. A graph presented below shows the same information:
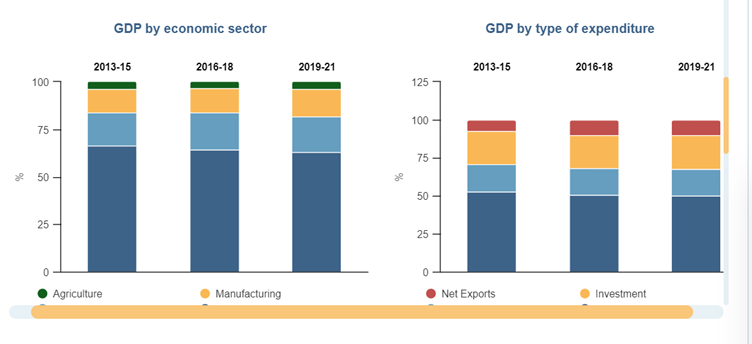
Source: (FocusEconomics. 2024)
International Trade Relations between India and Russia
As per the current pact between India and Russia, the trade relation is likely to grow further in the coming years as volume of exports and imports have increased. It is accepted that by 2025, the bilateral trade would reach the level of US$ 50 billion which is more than last 5 years trade data. The trade arrangement between two nations are beneficial for both the countries and after the declaration of the Ukrainian War, India has been a constant partner for Russia to support international trade. Some of the common imports which has been made from Russia is fuels and defence equipment and machines. In an overall basis, it can be said that sound relation exists between India and Russia when it comes to international trade.
Evaluation of trade between India and Russia
Overview of Bilateral Trade:
India and Russia maintain a strong bilateral trade relation. The growing relation between the two nations have significant impact on the foreign policy of India. The bilateral relation strengthened after the two nations signed “Declaration on the India-Russia Strategic Partnership” in 2000. Not only in trade, India and Russia maintained cooperation in other areas such as politics, defence, security, science & technology and cultural ties (ibef.org, 2023). Table 1 shows trade statistics between Russia and India for the last ten years (2013-2021).
Table 1: Bilateral Trade figures between India and Russia from 2012-2022
| Year | India’s Import from Russia | India’s export to Russia | Total trade | |
| 2012 | 7.91 | 3.04 | 10.95 | |
| 2013 | 7.01 | 3.1 | 10.11 | |
| 2014 | 6.34 | 3.17 | 9.51 | |
| 2015 | 5.58 | 2.26 | 7.84 | |
| 2016 | 5.23 | 2.36 | 7.59 | |
| 2017 | 6.46 | 2.9 | 9.36 | |
| 2018 | 7.75 | 3.23 | 10.98 | |
| 2019 | 7.24 | 3.92 | 11.16 | |
| 2020 | 5.83 | 3.48 | 9.31 | |
| 2021 | 7.6 | 3.68 | 11.28 | |
| 2022 | 46.21 | 3.14 | 49.35 |
(Source: indianembassy-moscow.gov.in, 2023)
As shown in table 1, in last 10 years the trade relations has been stable between India and Russia and this will increase in the coming years. As per the data available, the export rate for Russia is more than India in the bilateral agreement and this results in a positive balance of payments for Russia. In 2022–2023, India exported $46.21 billion worth of goods to Russia, while India exported $3.14 billion worth of goods to Russia, totaling $46.21 billion in commerce between the two nations. Drug products, metallic materials, biologicals, marine products, chemical residue and related products, and industrial machinery for the dairy industry are among India’s top exports to Russia. India imports a large amount of petroleum products, coal, precious stones, pearls, fertilisers, vegetable oils, coke and briquettes, crude petroleum, and inorganic chemicals from Russia. During the second quarter of 2023, trade between India and Russia expanded by an additional 161.22%. (ibef.org, 2023).
Top Dissertation Topics UK
Table 2: Balance of payment in net trade of goods and services for Russia and India
| Year | Russia | India |
| 2012 | 145.08 | -136.06 |
| 2013 | 122.31 | -92.14 |
| 2014 | 133.65 | -67.97 |
| 2015 | 111.25 | -63.25 |
| 2016 | 66.26 | -41.58 |
| 2017 | 83.23 | -72.21 |
| 2018 | 164.98 | -105.92 |
| 2019 | 129.33 | -73.45 |
| 2020 | 76.65 | -8.34 |
| 2021 | 169.95 | -74.04 |
| 2022 | 293.31 | -134.66 |
(Source: worldbank.org, 2023)
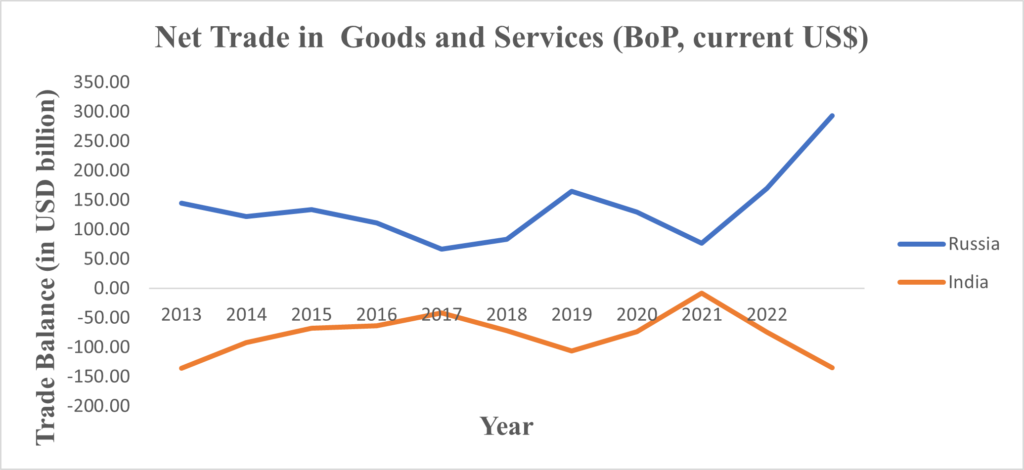
Figure 1: Net trade balance in India and Russia from 2013 to 2022
(Source: worldbank.org, 2023)
In terms of overall trade balance, as shown in figure 1, Russia experienced an overall trade surplus while for India there has been a continuous trade deficit. For Russia, trade surplus was USD 122.31 billion in 2013 which increased to USD 293.91 billion in 2022. This reflects a strong position of Russia in international market in terms of trade. In case of India however the trade deficit widened indicating a higher amount of import over its export. In 2022, the trade deficit of India amounted to be USD 134.66 billion which was around USD 92.14 billion in 2013.
Government policies to promote bilateral trade
The governments of both countries have created economic strategies with multiple economic facets in an effort to boost bilateral trade. By 2025, both countries wanted to reach a $20 billion trade volume. Russia and India are now working together on projects in a variety of industries, including the chemical, oil, energy, food, pharmaceutical, and military-industrial complex sectors. Additionally, both countries are concentrating on enhancing their insurance and interbank cooperation. Increasing trade and economic relations between the two countries is the responsibility of the India-Russia Intergovernmental Commission’s (IRIGC-TEC) Trade, Economic, Scientific, Technological, and Cultural Cooperation division (indianembassy-moscow.gov.in, 2023).
Analysis of exchange rate market of India and Russia
Overview of exchange rate system in India and Russia
In India the management of exchange rate system has developed overtime. During 1947-1971, India followed a per value system under which value of rupee was fixed equivalent to 4.15 grains of gold. After that India followed a pegged regime till December 1991 where currency was pegged against US dollar and pound sterling. Currently India follows a liberalised exchange rate management system which was announced in 1992-93. This system was aligned with partial convertibility of rupee. This follows a dual exchange rate where 40% of the exchange rate was fixed to official exchange rate and rest of 60% was converted at market determined rate (Rishad, Gupta & Sharma, 2021). Russia follows floating exchange rate since November 2014. There was no intervention from Bank of Russia in determining the official exchange rate. Respective authorized banks are responsible for determining the exchange rate for their independent foreign exchange operations. Figure 2 below shows official exchange rate of India and Russia against USD for last ten years (2012-2022)

Figure 2: Official exchange rate against USD for India and Russia
(Source: worldbank.org, 2023)
In the year 2012, the exchange rate of Russian Rubble against USD was 30.84. The same of Indian Ruppe against USD was 53.44. Overtime, there was an increase in exchange rate for both the currency. This indicates a depreciation of Russian Rubble and Indian Rupee against US dollar. However, the rate of depreciation for Russian Rubble is relatively higher compared to Indian Rupee. In 2022, the official exchange rate for India was 78.60 and for Russia it was 68.48. The ongoing devaluation of the Indian Rupee relative to the US dollar was primarily caused by a number of factors, such as inflation, trade deficits, fiscal budget deficits, economic crises, and rising fuel prices globally.
However, immediately after independence Rupee was in a stronger position as it was pegged against dollar. However, liberalization in the foreign exchange market in 1991 along with currency devaluation to increase exports and foreign investment. After that financial crisis in 2008, 2010, COVID 19 crisis in 2020 along with other domestic and international economic event led to a depreciation of the currency. One significant factor contributing to depreciation of Russian Rubble is heavy dependency on the economy on oil export. The drop in oil prices in 2013 led to a decline in the currency value (Tarasenko, 2021). The Ukraine Russia war is another important factor causing a depreciation of the currency in recent past.
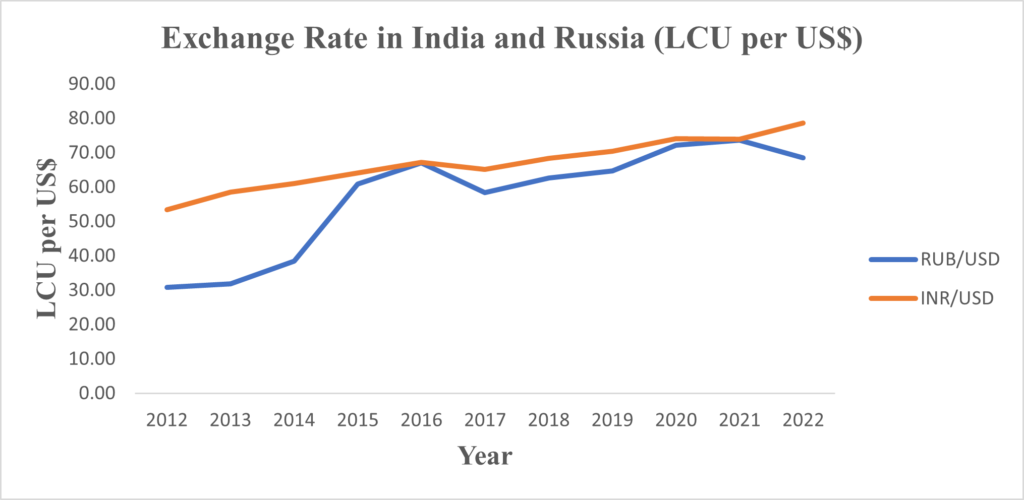
Figure 3: Exchange rate between Indian Rupee and Russian Rubble
(Source: tradingeconomics.com, 2024)
Figure 3 shows a volatile rate of exchange between Indian Rupee and Russian Rubble. The currencies traded at a value of 1.11 in February which was 0.58 percent higher compared to the last trading session. The value is forecasted to be increased further by end of this year.
Interest Rate
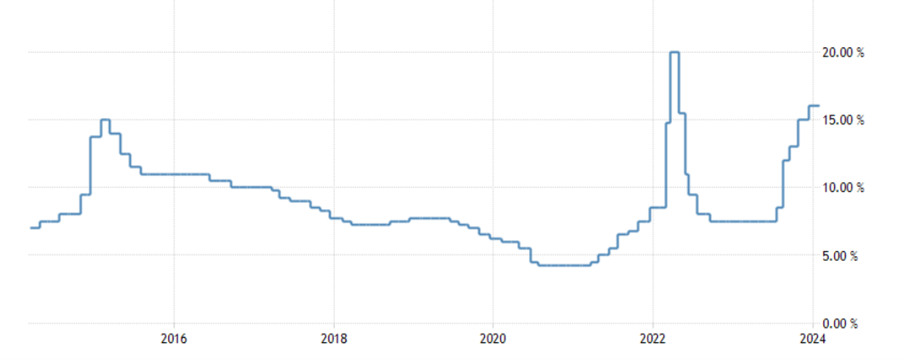
Figure 4: Key Interest Rate in Russia
(Source: tradingeconomics.com, 2024)
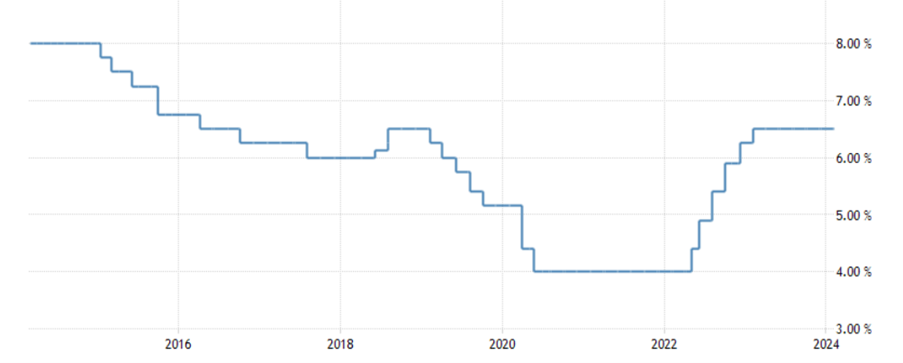
Figure 5: Key Interest Rate in India
(Source: tradingeconomics.com., 2024)
Interest rate is one significant determinant of exchange rate. Considering the continuously weakened currency, Bank of Russia increased the key interest rate. The rate was increased to 16% in December 2023 which was below 8% at beginning of the year. Compared to Russia, the central bank of India has kept the interest rate at a relatively stable state. Since the beginning of 2023, interest rate has been kept at 6.50%. The Reserve Bank of India has decided to keep the key interest rate unchanged with the anticipation of persistent increase in the price level.
Get Assignment Help for Top Subjects
Purchasing Power Parity
The purchasing power parity refers to the rate of currency conversion which equalizes purchasing power of two different currencies after eliminating the discrepancies in the price level. It is the ratio of relative prices of two national currencies for the same basket of goods and services (Wagner, 2020). Figure 6 presents the PPP conversion rates of Indian and Russian currency against US dollar.
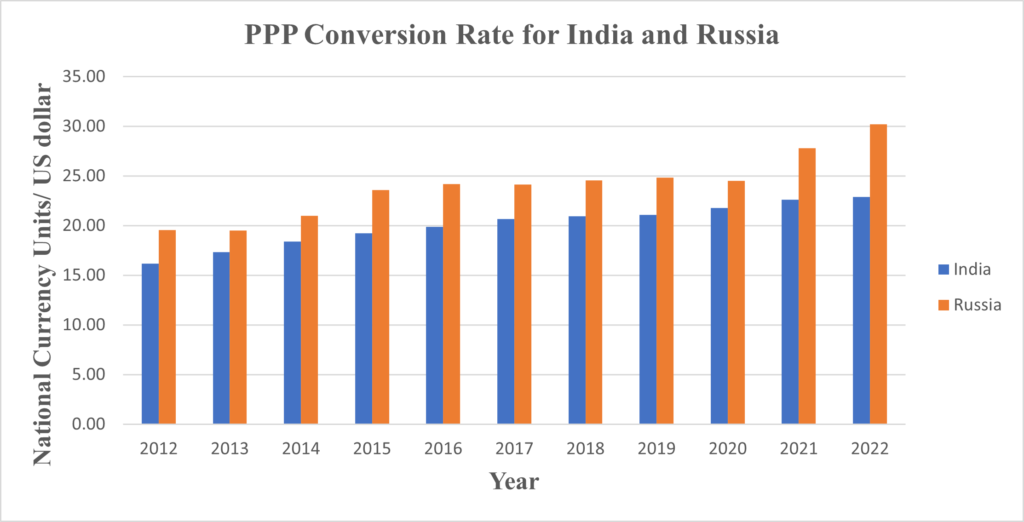
Figure 6: PPP conversion rate for India and Russia from 2012 to 2022
(Source: oecd-ilibrary.org, 2023)
For both the countries there is an increase in the PPP conversion rates against US dollar indicating a declining value of the currency. In India, the PPP conversion rate was 16.12 in 2012 which increased to 22.88 in 2022, For Russia, PPP increased to 30.19 in 2022 which was 19.57 on 2012.
Conclusion
The above analysis appropriately shows that both India and Russia rely on international trade arrangements for their economic growth and both nations have an amicable trade relations. The above analysis shows the different products which are exported and imported and the economic outlook for both the countries in last 5 years. The analysis further shows different factors which affects international trade arrangement and utilises data to validate the information.
Reference
Deloitte. (2024, January 24). India Economic Outlook, January 2024. Deloitte Insights. https://www2.deloitte.com/us/en/insights/economy/asia-pacific/india-economic-outlook.html
FocusEconomics. (2024, February 5). Russia archives. FocusEconomics. https://www.focus-economics.com/countries/russia/
ibef.org. (2023). Exploring India russia trade and economic relations: IBEF. India Brand Equity Foundation. https://www/indian-exports/india-russia.ibef.org-trade
indianembassy-moscow.gov.in. (2023). Bilateral relations: India-Russia relations. Embassy of India, Moscow (Russia). https://indianembassy-moscow.gov.in/bilateral-relations-india-russia.php#:~:text=On%20November%208%2C%202022%2C%20EAM,deficit%20and%20market%20access%20issues.
indianembassy-moscow.gov.in. (2023). Brief on India-Russia Economic Relations. Embassy of India, Moscow (Russia). https://indianembassy-moscow.gov.in/overview.php
oecd-ilibrary.org. (2023). Purchasing power parities (PPP). OECD iLibrary. https://www.oecd-ilibrary.org/finance-and-investment/purchasing-power-parities-ppp/indicator/english_1290ee5a-en
Rishad, A., Gupta, S., & Sharma, A. (2021). Official Intervention and Exchange Rate Determination: Evidence from India. Global Journal of Emerging Market Economies, 13(3), 357-379. https://doi.org/10.1177/09749101211031123
Tarasenko, I. (2021). The impact of exchange rate volatility on trade: The evidence from Russia. Russian Journal of Economics, 7(3), 213-232. https://doi.org/10.32609/j.ruje.7.57933
tradingeconomics.com. (2024). India interest rate. https://tradingeconomics.com/india/interest-rate
tradingeconomics.com. (2024). INRRUB indian rupee russian rublecurrency exchange rate live price chart. INRRUB Indian Rupee Russian Ruble – Currency Exchange Rate Live Price Chart. https://tradingeconomics.com/inrrub:cur
tradingeconomics.com. (2024). Russia interest rate. https://tradingeconomics.com/russia/interest-rate#:~:text=The%20benchmark%20interest%20rate%20in,percent%20in%20July%20of%202020.
Wagner, R. E. (2020). Macroeconomics as systems theory. Springer International Publishing.
worldbank.org. (2023). NET trade in goods and services (BOP, current US$) – russian federation, India. World Bank Open Data. https://data.worldbank.org/indicator/BN.GSR.GNFS.CD?end=2022&locations=RU-IN&start=2013
worldbank.org. (2023). Official Exchange Rate (LCU per US$, period average). World Bank Open Data. https://data.worldbank.org/
Dissertation - Digi Assignment Help
-
How to Analyze Data for a Macroeconomics Dissertation ?by Amelia on May 6, 2025
Macroeconomics is a branch of economics that deals with the performance, structure, behaviour, and decision-making of an economy as a whole. Through Macroeconomics analysis, you will learn about interest rates, inflation, growth, employment, politics, and… The post How to Analyze Data for a Macroeconomics Dissertation ? first appeared on Digi Assignment Help.
-
How to Write an Accounting Dissertation: A Guide for UK Studentsby Amelia on February 19, 2025
UK students who do research in accounting should always update themselves with the current happenings, current issues, and modern aspects of the particular issue. Universities throughout the globe are competing to develop their research profile… The post How to Write an Accounting Dissertation: A Guide for UK Students first appeared on Digi Assignment Help.
-
How to Write a Dissertation on Patient-Centered Careby Amelia on February 7, 2025
Patient-centered care is a nuanced topic that has a great impact on healthcare. It primarily involves prioritising a patient’s requirements, preferences, and values. Writing a dissertation is a milestone in your academic journey, and writing… The post How to Write a Dissertation on Patient-Centered Care first appeared on Digi Assignment Help.
-
How to Structure a First-Class Dissertation: A Guide for UK Studentsby Amelia on February 6, 2025
Dissertations are worth so much, if you’re in your final year of the UK University, it’s worth a good chunk. Sometimes even 50, something even 100 of your final year mark. So, it is really… The post How to Structure a First-Class Dissertation: A Guide for UK Students first appeared on Digi Assignment Help.
-
Tips for Writing a Compelling Dissertation Abstractby Amelia on February 4, 2025
Why Abstract Matters? Abstract matters because it’s the first thing, or one of the first things, that somebody reading your thesis is going to see. Who is going to be reading your thesis, it’s your… The post Tips for Writing a Compelling Dissertation Abstract first appeared on Digi Assignment Help.
-
Dissertation Structure and Formatting Guidelines for UK Studentsby Amelia on January 10, 2025
The structure and format of a dissertation are critical for presenting your research or thesis in a well-organized and professional manner, enhancing its academic value and effectively showcasing your contributions to the field. Title Page… The post Dissertation Structure and Formatting Guidelines for UK Students first appeared on Digi Assignment Help.