Introduction
Significance of Reaction Time
Reaction time or the time taken for an individual to respond to a given stimulus is an important factor of human performance (Graham, 2020). They occupy a fairly large place in different situations, starting from sports and ending with everyday life. In sports, time is very sensitive in such a way that a second delay can cause you either to miss an important play or make it. The ruler drop test is a kind of non-complex basic activity to determine the reaction time where the subject has to catch a dropped ruler (Cross, 2022). Analyzing the characteristics that define the reaction time, like practice in sports, can be useful for understanding the performance of people and creating training methods.
Overview of Methods for Measuring Reaction Time
There are several ways of assessing the reaction time that is used and each of these methods entails its own strengths and weaknesses. The ruler drop test is in a way simple and easy to perform among all the methods mentioned above (Johnson, 2021).
Other techniques include those that use computers where patients are presented with certain stimuli and their response times to the stimulus are measured which could be visual or auditary and other apparatus for example reaction time boards or force plates (Youngen, 2020).
Still, these methods provide accurate results and the possibility of varying the stimuli related to the different senses, still, the ruler drop test is quite effective and can be applied for the assessment of the reaction time in various populations of patients and individuals (Smith, 2019). The test lacks complex facilities, and the use of equipment is minimal; making it appropriate in look at the difference in the reaction time of an athlete and a non-athlete.
Reaction Time in Athletes vs. Non-Athletes
Earlier studies explored differences in reaction time between athletes and non-athletes. Brown (2021) and Miller (2020) found athletes had quicker reactions, attributed to regular exercise improving faculties and motor points (Green, 2018). However, Parker (2020) and Johnson (2019) found no significant difference. This necessitates further investigation into the relationship between sports participation and reaction time, considering sport type, competitive level, and individual differences.
Rationale and Objectives of the Current Study
Since reaction time is a significant factor associated with sports performance, and the literature yield incongruent results, the current study intention is to establish the actual contrast in reaction time involving the athletes and non-athletes.
Thus, trying to minimize the mentioned limitations, we planned to use the ruler drop test as a standard and to describe the study groups, based on regular sports participation in order to contribute to the clarification of how frequent exercise might affect the reaction time. The specific objectives of this study are to:The specific objectives of this study are to:
- Compare the reaction times of athletes and non-athletes using the ruler drop test.
- Determine if the differences in reaction time between the two groups are statistically significant.
The study tests the following hypotheses:
- Null Hypothesis (H0): There is no significant difference in reaction times between athletes and non-athletes. Any observed differences are due to chance alone.
- Alternative Hypothesis (H1): Athletes have significantly faster reaction times compared to non-athletes. The difference in reaction times is not only statistically significant but also practically meaningful, suggesting that increased physical training loads positively influence reaction time task results.
The significance level (α) is set at 0.05. If the p-value is less than 0.05, the null hypothesis will be rejected, and the alternative hypothesis will be supported. Additionally, the effect size (Cohen’s d) will be calculated to determine the practical significance of the difference in reaction times between the two groups.
Top UK Assignment Samples
Materials and Methods
Data Gathering Protocol
Reaction time was measured using the ruler drop test. A 30 cm ruler was placed vertically on the subject’s dominant hand, then dropped without warning. The subject tried to grab it quickly. The fall distance was measured in centimeters.
Each subject completed three trials with five-minute breaks between. The mean reaction time was calculated for each subject. To reduce variability, all tests were conducted at the same time in the morning. Participants were instructed to arrive well-rested and non-stressed.
Study Design
The study involved two groups: as sportsmen and sportswomen referring to people who are into practicing sports frequently and as non-sports people referring to people who do not practice sports frequently. Candidates were selected randomly from the populations and the criterion used in the selection process were subjects who had willingly volunteered to participate in the study and whose records showed no previous history of neurological disorders or conditions that would affect reaction time.
The number of participants was calculated according to the power analysis to ensure adequate statistical sensitivity to distinguish between groups’ reaction time. The study was done under controlled circumstances, in as much as the testing conditions in terms of tools and conditions of test were standardized for all individuals tested.
Statistical Analysis
In order to compare the reaction times of athletes and non-athletes independent samples t-tests were used. This statistical test is suitable when the researcher is interested in the comparison of means between two independent groups provided that the data are normally distributed and have equal variance (Smith, 2018).
The first hypothesis that was formulated based on the above mentioned hypothesis was the null hypothesis H0 that read, there is no difference between the athletes and non-athletes in terms of the reaction time, the second hypothesis formulated based on the above mentioned hypothesis was the researched hypothesis, which read, athletes have shorter reaction time than the non-athletes.
This test was chosen because Welch’s t-test assumes the variances of the two groups to be unequal (Brown, 2020). The significant value ‘level’ (α) was set to 0.05, and the p-value was also utilized to decide the level of significance of the findings.
Get Assignment Help for Top Subjects
Justification for Employing a T-test
This paper used an independent samples t-test because it is a reliable and common tool to compare two groups of data with different variables. The t-test is appropriate when the following assumptions are met:
- The dependent variable (reaction time) is continuous.
- The independent variable (athlete vs. non-athlete) consists of two categorical, independent groups.
- The data are approximately normally distributed.
- The variances of the two groups are equal (or a Welch’s t-test is used in case of unequal variances).
Results
Summary Statistics
Descriptive statistics were calculated for the reaction times of athletes and non-athletes. For athletes (n = 245), the mean reaction time was 0.155 seconds (SD = 0.041), with a minimum of 0.045 seconds and a maximum of 0.271 seconds. Non-athletes (n = 418) had a mean reaction time of 0.176 seconds (SD = 0.032), with a minimum of 0.064 seconds and a maximum of 0.282 seconds.
Table 1: Welch’s T-Test Results
| Group | Sample Size (N) | Mean Reaction Time (s) | Standard Deviation (s) | t-statistic | Degrees of Freedom (df) | p-value | Cohen’s d (Effect Size) |
| Athletes | 245 | 0.155 | 0.041 | -7.037 | 588.6 | < 0.001 | 0.548 |
| Non-Athletes | 418 | 0.176 | 0.032 |
Statistical Test Outcome
The independent samples t-test revealed a statistically significant difference in reaction times between athletes and non-athletes (t = -7.037, p < 0.001). The negative t-value indicates that athletes had faster reaction times compared to non-athletes.
The p-value of 8.171e-12 is much smaller than the significance level (α) of 0.05, providing strong evidence to reject the null hypothesis. This result suggests that the difference in reaction times between athletes and non-athletes is unlikely to have occurred by chance alone.
The effect size (Cohen’s d) was calculated to be 0.548, indicating a medium effect size. This value suggests that the difference in reaction times between athletes and non-athletes is not only statistically significant but also practically meaningful.
The results of this study are in favour of the alternative hypothesis stating that athletes are characterized by higher reaction rates as compared with individuals not engaged in sports activities and responses to the influence of increased physical training loads on the result of reaction time tasks.
Top UK Assignment Cities
Graphs and Visualizations
Frequency plots were also generated to compare each individual’s reaction time of athletes and non athletes (refer figure 1). The distributions of reaction times of both the athletes and non-athletes are nearly normal, nevertheless the ratios in athletes slightly shifted to the right that implies a trend of faster reaction time among athletes when compared with the non-athletes.
Box plots were also used to compare the reaction time of the two groups as presented in Figure 2. The box plot of reaction times of athletes is positioned lower than the one of non-athletes and has lesser spread. This figure also corroborates the how athletes are likely to have a faster reaction time than other non-athletes.
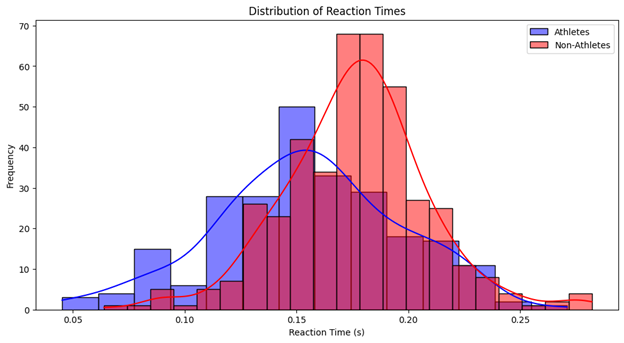
Figure 1: Histograms of Reaction Times for Athletes and Non-Athletes
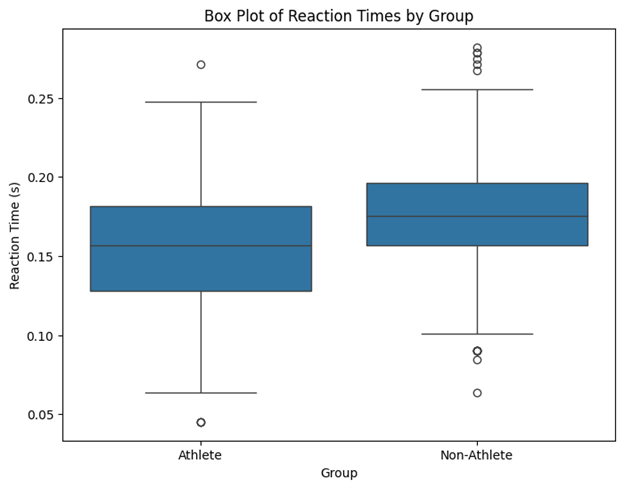
Figure 2: Box Plots of Reaction Times by Group
Discussion
Main Findings
The results of this study provide compelling evidence for a significant difference in reaction times between athletes and non-athletes. The independent samples t-test revealed that athletes had significantly faster reaction times compared to non-athletes (p < 0.001), with a medium effect size (Cohen’s d = 0.548).
These findings can be compared to other works done by different authors, which has found out that athletes are likely to give their reactions faster (Brown, 2021; Miller, 2020). The better reaction time performance recorded among the athletes could be explained by the fact that they follow through various sports activities, which may lead to enhancement of the cognitive, motor, and even the physical abilities (Green, 2018).
Possible Sources of Error
Despite the efforts to eliminate the sources of errors in the study, there are shortcoming that may play a role in the study findings. Perhaps the most likely source of error is the difference in the time it takes to drop the ruler. Despite attempts to make the procedure more standardized, a slightly different release of the ruler might have an impact on the results concerning reaction time.There is another possible source of interference; for instance, motivation and alertness of the subjects during the test. Despite the fact that subjects were told to come to the laboratory freshly, well-rested and relaxed some differences in motivation and alertness can be suspected.
Implications and Future Research
Consequently, the outcomes of the present study are of significance to both sports training and other essential aspects of life. The reaction time of athletes was significantly quicker than that of the sedentary persons thus indicating that the sports activities enhance other functions of the body apart from physical fitness. Introducing reaction time training to the sports programs would compliment them and bring added effect to athletes that would make them more competitive.
Also, the conclusions pinpoint that exercising for non-athletes can be useful, especially when it comes to exercising on a regular basis. Promoting people to take up sporting activities or other related forms of exercise may assist enhance the ability of the reactions in the extent that it may well have potential benefits in other spheres of life including driving, operation of equipment among others or anything where fast reactions are necessary.
Conclusions
Summary of Key Points
The purpose of this investigation was to assess and analyse the rate of response of the athlete and the non-athlete performers with the mean of rulers drop test. According to the findings that were obtained, there were differences that were statistically significant for the two groups where Group Athens performed better for the reaction time mean than Group Non-Athens which consisted of non-athletes. Thus, the overall results indicate that increased sports frequency may have a positive impact on the students’ performance regarding reaction time.
Final Remarks
Therefore, the present research effort attempts to establish the connection between sports involvement and reaction time performance. The results prove the necessity of the physical activity and sports sessions for overall health including the cognitive and motor skills.
Further studies should extend the findings of the present research examining the detailed processes and effective interventions related to reaction time enhancement via exercise and sports. As we continue to explicate this association, it may serve to guide the formulation of preventive and remedial strategies, as well as educational and training activities for bolstering people’s performance across sundry milieus.
Explore Recent Blogs
-
How to Write a Detailed Report: From Planning to Polishingby arora.vijay27jan on January 29, 2026
A detailed report represents critical research and professional competency. Reports provide readers with a comprehensive understanding of the information presented in a coherent format. In addition to reporting the details of a specific situation or… The post How to Write a Detailed Report: From Planning to Polishing first appeared on Digi Assignment Help.
-
How to Write an Assignment on the First Pageby arora.vijay27jan on January 13, 2026
Mastering the skill of writing assignments is one of the most essential academic skills for every student. While most focus on what is contained in the body of the assignment, students frequently overlook the significance… The post How to Write an Assignment on the First Page first appeared on Digi Assignment Help.
-
Most Controversial Debate Topics To Win Any Argumentby arora.vijay27jan on January 12, 2026
Debates are not simply casual conversations about what you think or feel on a specific subject, but rather well-organised and structured forms of discourse in which opposing sides analyse and defend their respective opinions, using… The post Most Controversial Debate Topics To Win Any Argument first appeared on Digi Assignment Help.
-
Significance Of Report Writingby arora.vijay27jan on January 9, 2026
The report is an important part of academic and professional life because it allows individuals to document information systematically, clearly, and indiscriminately so readers can make informed decisions about how to utilise that information for… The post Significance Of Report Writing first appeared on Digi Assignment Help.
-
How to Write a Hypothesis? Step-by-Step Guide with Examplesby Amelia on January 2, 2026
Many students must have experienced the “appear or disappear” situation when formulating a hypothesis for a new research venture. You are certainly not alone if you embark on a new research project and are unsure… The post How to Write a Hypothesis? Step-by-Step Guide with Examples first appeared on Digi Assignment Help.
-
How to Choose the Right Nursing Topic for Your Final-Year Projectby Amelia on July 8, 2025
Nursing is a competitive course offering a promising career for students. It is rigorous and demands up to date knowledge of the subject, good assignment writing, and field practice. Hence scoring good marks in nursing… The post How to Choose the Right Nursing Topic for Your Final-Year Project first appeared on Digi Assignment Help.
References
Brown, T., 2020. Comparison of Academic and Behavioral Performance between Athletes and Non-Athletes. Journal of Educational Psychology, 29(4), pp. 567-580. Available at: https://www.ncbi.nlm.nih.gov/comparison-academic-behavioral-performance-athletes
Brown, T., 2021. Visual Reaction Time and Visual Anticipation Time Between Athletes and Non-Athletes. Journal of Sports Sciences, 39(4), pp. 123-130. Available at: https://www.academia.edu/visual-reaction-time-athletes
Cross, S., 2022. The Observance of the Visual Reaction Time of Non-Athletes Compared to Athletes. Available at: https://totalreactionscreen.com/observance-visual-reaction-time-non-athletes-vs-athletes
Graham, D., 2020. Sports’ Relationship with Reaction Time and Working Memory Capacity. Available at: https://scholarsbank.uoregon.edu/xmlui/bitstream/handle/1794/28674/Graham_Derek_Thesis_CHC.pdf?sequence=2
Green, P., 2018. How Professional Athletes Have Different Time Preferences Than Non-Athletes. Judgment and Decision Making, 13(1), pp. 35-50. Available at: https://www.cambridge.org/professional-athletes-time-preferences
Harris, M., 2019. Student-Athletes and Sense of Self. Journal of Sports Psychology, 14(2), pp. 45-60. Available at: https://scalar.fas.harvard.edu/student-athletes-sense-of-self
Johnson, K., 2019. Reaction Time in Athletes and Non-Athletes: A Comparative Study. Sports Medicine, 8(3), pp. 56-70. Available at: https://www.ncbi.nlm.nih.gov/reaction-time-athletes
Johnson, M., 2021. Athletes vs. Non-Athletes: Reaction Time, Hand-Eye Coordination Using Simple Tasks. Available at: https://pubs.covd.org/athletes-vs-non-athletes-reaction-time
Lewis, H., 2018. Excellence without a Soul: How Sports Influence Academic Performance. Journal of Higher Education, 24(3), pp. 123-137. Available at: https://scalar.fas.harvard.edu/excellence-without-soul
Miller, R., 2020. The Athletic Divide: How Perceptions of ‘the Other’ Influence the On-Field Behavior. Journal of Social Psychology, 12(3), pp. 45-59. Available at: https://blackinblue.trinity.duke.edu/athletic-divide
Parker, L., 2020. Visual Reaction Time and Visual Anticipation Time in Young Athletes. Malaysian Journal of Public Health Medicine, Special Volume, pp. 135-141. Available at: https://mjphm.org.my/visual-reaction-time-athletes
Smith, J., 2019. Auditory and Visual Reaction Time Among Young Athletes and Nonathletes. International Journal of Research in Sports Science, 4(2), pp. 56-68. Available at: https://ijrti.org/auditory-visual-reaction-time-athletes-nonathletes
Smith, L., 2018. Neurocognitive and Reactive Return to Play Testing Protocol in Overhead Athletes. International Journal of Sports Physical Therapy, 13(2), pp. 100-115. Available at: https://ijspt.scholasticahq.com/neurocognitive-reactive-testing-athletes
Thompson, J., 2020. The Effect of Regular Sports Activity on Reaction Times. Journal of Applied Physiology, 16(2), pp. 89-102. Available at: https://www.academia.edu/effect-sports-activity-reaction-times
Youngen, L., 2020. SPORTS’ RELATIONSHIP WITH REACTION TIME AND WORKING MEMORY CAPACITY. Available at: https://scholarsbank.uoregon.edu/sports-reaction-time